“New Federal Report Demonstrates Reduction in Child Maltreatment Victims and Underscores Need for Continued Action,” the Administration on Children and Families (ACF) of the US Department of Health and Human Services proclaimed in releasing the latest annual report on the government response to child abuse and neglect. As in the past several years, ACF’s language suggested that child abuse and neglect are decreasing. But with states around the country changing law, policy and practice to reduce child welfare agencies’ footprint, the number of “child maltreatment victims” cited by ACF is likely more a reflection of policy and practice than an indicator of actual maltreatment.
The annual Child Maltreatment reports, produced by the Children’s Bureau of ACF, are based on data that states submit to the National Child Abuse and Neglect (NCANDS) data system. The new report, Child Maltreatment 2023 (CM2023), provides data for Federal Fiscal Year (FFY) 2023, which ended on September 30, 2024. The report documents the funnel-like operations child welfare protective services (CPS), which at each stage select only a fraction of the cases or children to proceed to the next stage. Exhibit S-2 summarizes the findings of the newest report. Child welfare agencies received 4.399 million “referrals” alleging maltreatment in Federal Fiscal Year (FFY) 2023 and “screened in” 2.1 million of them as “reports” for “disposition” through an investigation or alternative response. The investigation or assessment of those reports resulted in a total of 546,159 children determined to be victims of child abuse and neglect. (The final stage of the funnel involves services and is not covered in this post.) State and local policies and practice affect every stage of this process, as explained in detail below.

Referrals
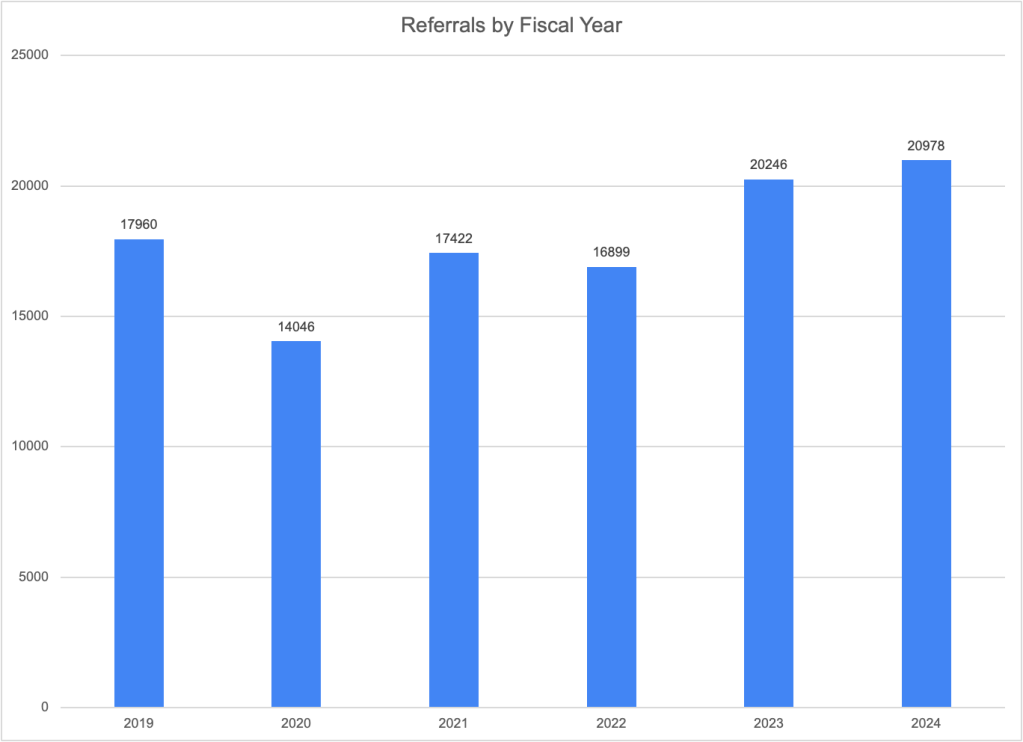
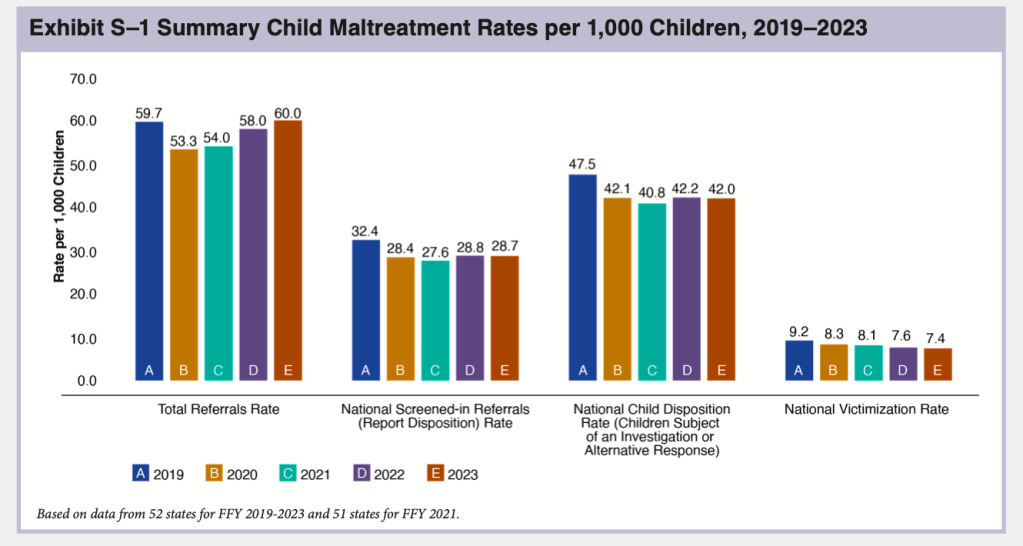
NCANDS uses the term “referrals” to mean reports to child welfare agencies alleging maltreatment. Agencies received an estimated total of 4,399,000 referrals through their child abuse hotlines or central registries in FFY 2023, according to CM 2023. This is a very slight increase over the previous year and represents about 7.8 million children, or 60 per 1,000 children. As shown in Exhibit S-1, the total number of referrals has been increasing since 2020, when the COVID-19 pandemic resulted in a large drop in referrals. In FFY 2023, the number of referrals surpassed the pre-Covid 2019 total for the first time as the lingering effects of the pandemic, which acted to suppress reports, finally dissipated.
As in past years, the state-by-state tables document large differences in referral rates, from 19.9 per 1,000 children in Hawaii to 171.2 per 1,000 in Vermont–also the top and bottom states in 2022. These differences reflect not just different numbers of calls to child abuse hotlines but also state policy and practice. Vermont reports that it counts all calls to the hotline as referrals, while other states do not do so. For example, Connecticut reported in CM2022 that none of the calls that are assigned to alternative response are included in NCANDS, resulting in a far lower number of calls than the number they actually receive. Referral rates may also affected by a state’s policy on who is required to report and what must be reported. Such policies are disseminated to mandatory reporters through training and agency communications. New York reported implementing in FFY 2023 a new training for mandated reporters that helps them identify when concerns do not rise to a level legally requiring a report be made.” The training also focuses on implicit bias in order to “reduce the number of SCR reports influenced by bias about race or poverty.” The number of referrals in New York dropped by a very small fraction in FFY 2023. Missouri reported in CM2022 that it stopped accepting educational neglect referrals in 2021 as the COVID emergency ended, resulting in a decreased number of referrals received the following year.
Reports
Once a state agency receives a referral, it will be screened in or out by agency staff. In general, referrals are screened out if they are deemed not to contain an allegation of child abuse or neglect, contain too little information to act on, are more appropriately assigned to another agency, or for some other reason do not fall under the mandate of the child welfare agency. In the language used by NCANDS, a referral becomes a “report” once it is screened in. “Reports” are assigned for an investigation or “alternative response.” State data indicates that child welfare agencies screened in 2.1 million referrals, about 47.5 percent of referrals for an investigation or alternative response, and “screened out” the other 52.5 percent as not warranting a response. The number of screened-in referrals was 11.6 percent less than in FFY 2019 and slightly less than in FFY 2022.
A total of 42 states reported a decrease in the number of screened-in referrals in FFY 2023. In their commentaries, several of these states described policy and practice changes that led to their screening out more referrals. Ohio reported that two of its major metropolitan counties, which had significantly higher screen-in rates than the rest of the state, adjusted their screening procedures to be consistent with the rest of the state, resulting in a lower screen-in rate in those counties and statewide. Mississippi reported an increasing the amount of screening it conducted, especially when a report was received regarding a case that was already open; perhaps this is why its screen-in rate dropped from 41.3 to 36.5 per 1,000 children. Nebraska reported dropping a policy to require accepting all referrals from a medical professional involving children under six. Some states explicitly reported that their screening changes were adopted in order to decrease the number of screened in referrals. Kentucky reported adopting a new SDM® screening tool designed to decrease the number of referrals that are “incorrectly accepted for investigation.” Nevada reported a decrease in screened-in referrals because it established new intake processes to ensure that referrals are screened out when they do not meet criteria for acceptance.
“Victims”
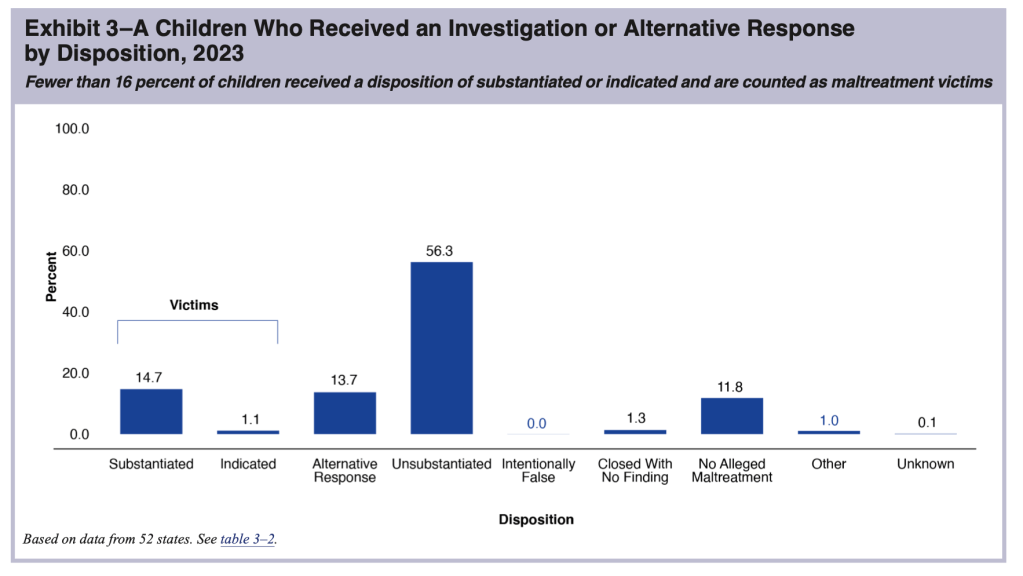
The next phase in the funnel of CPS is the determination of whether abuse or neglect has occurred. At this stage, the level of analysis shifts from the case to the child, and the number of “victims” is the result. In NCANDS, a “victim” is defined as “a child for whom the state determined at least one maltreatment was substantiated or indicated1; and a disposition of substantiated or indicated was assigned for a child in a report.” “Victims” include children who died of abuse or neglect if the maltreatment was verified. Some children receive an “alternative response”2 instead of an investigation; these children are not counted as victims. According to CM2023, states reported a total of 546,159 victims of child abuse and neglect in FY 2023, producing a “victimization rate” of 7.4 per 1,000 children.
The number of “victims” reported by states according to the NCANDS definition does not represent the true number of children who experienced abuse or neglect, which is unknown. Many cases of child maltreatment go unreported. Children assigned to alternative response are not found to be victims unless their case is reassigned to the investigation track. And finally, substantiation may not be an accurate reflection of whether maltreatment occurred. Making a determination of whether maltreatment occurred is difficult. Adults and children do not always tell the truth, the youngest children are nonverbal or not sufficiently articulate to answer the relevant questions. So it is not surprising that research suggests that substantiation decisions are inaccurate3 and a report to the hotline predicts future maltreatment reports and developmental outcomes almost as well as a substantiated report.4
State “victimization rates” range from a low of 1.5 per 1,000 children in New Jersey to a high of 16.2 in Massachusetts. It is unlikely that Massachusetts has more than ten times more child abuse and neglect victims than New Jersey–a not dissimilar Northeastern state. Policy and practice must be at play, including different definitions of abuse or neglect, levels of evidence required to confirm maltreatment, and policies regarding the use of alternative response or “Plans of Safe Care”5 to divert children from investigation, among other factors. Maine reported the second highest “victimization rate.” The Maine Monitor asked experts why this might be so. Among the reasons suggested were the definition of maltreatment; Maine allows abuse or neglect to be substantiated when there is a “threat” of maltreatment, even if there is no finding that it already occurred. In view of the deceptiveness of these terms, I have put the terms “victims” and “victimization rates,” when not preceded by the word “reported,” in quotation marks in this post.
The national “victimization rate” of 7.4 per 1,000 children, is a small decrease from 7.7 in FFY 2022 and the total number of reported “victims” was 19.3 percent less than the total reported in FFY 2019. This “victimization rate” has declined every year since FFY 2018. Of course, this decline is in part a result of the decline in the number of screened-in referrals that was discussed above. Any referral that is screened out is one less reported “victim,” even though some percentage of the screened-out referrals almost certainly reflected actual incidents of maltreatment.6 It is also clear that changes in policy and practice have contributed to the decline in the number of “victims” reported by states, as described below.
Policy and practice changes affecting “victimization” numbers
The change in the number of “victims” between FFY 2019 and FFY 2023 ranged from a 52 percent decrease in North Dakota to a 32 percent increase in Nevada, suggesting that these changes may reflect policy and practice more than actual trends in abuse and neglect. And indeed, two of the largest states made it more difficult to substantiate maltreatment in FFY 2022, and both found a decline in the number of maltreatment victims. In Texas, the legislature narrowed the definition of neglect, requiring the existence of both “blatant disregard” for the consequences of a parent’s action or inaction and either a “resulting harm or immediate danger.” Perhaps this helps account for the drop in the number of reported victims from 65,253 in FFY 2021 to 54,207 in FFY 2022. But the number of victims actually rose very slightly in FFY 2023. Perhaps the new definition had been assimilated into practice and was no longer resulting in a decrease in substantiations. In New York, the level of evidence required to substantiate an allegation of abuse or neglect was changed from “some credible evidence” to “a fair preponderance of the evidence” in FFY 2022. The number of victims found in New York dropped from 56,760 in FFY 2021 in to 50,056 in FFY 2022, which the Office of Child and Family Services attributed in its CM 2022 commentary to that change in evidentiary standards. The number of reported victims fell further to 46,431 in FY2023; perhaps the changed evidentiary standards were continuing to take hold or other state policies affecting other parts of the funnel–such as the attempt to rein in mandatory reporting–were contributing factors. The agency did not address this issue in its 2023 commentary.
A few states did mention in their CM 2023 commentary changes in policy or practice that might have contributed to changes in the number of “victims” in FFY 2023. North Dakota attributes a decrease partly to a change in state statute and policy which allows protective services to be provided when impending danger is identified, even without a substantiation. The agency appears to believe that workers are not substantiating as many reports now that they do not need a substantiation to provide services. Arkansas attributed a decrease in victims to the adoption of a new assessment tool that may have contributed to the routing of more reports to the differential response pathway. Kentucky reported that the adoption of new “Standards of Practice” may have contributed to the increase in the number of “victims” reported in FFY 2023.
Fatalities
Based on reports from 49 states (all but Massachusetts), the District of Columbia, and Puerto Rico, CM2023 estimated a national maltreatment fatality rate of 2.73 per 100,000 children. That rate was then applied to the child population of all 52 jurisdictions and rounded to the nearest 10 to provide a national estimate of 2,000. But experts agree that the annual estimates of child fatalities from NCANDS significantly undercount the true number of deaths that are due to child maltreatment. I discussed this in detail in A Jumble of Standards: How State and Federal Authorities Have Underestimated Child Maltreatment Fatalities.
The annual fatality estimates presented in the report increased by 12.3 percent between FFY 2019 and FFY 2022 and then fell slightly from 2,050 to 2,000 in FFY 2023, a fact that ACF mentioned in its press release. Such a small reduction of less than three percent over the previous year cannot be statistically distinguished from random fluctuation, especially because it is based on much-smaller numbers from the individual states. State commentaries illustrate the randomness of these year-to-year changes. In CM 2022, two individual states explained year-to-year jumps in fatalities by explaining that many children in one family died and that a large group of fatalities that occurred the previous year were reported in the current year. But even aside from statistical fluctuations, there are many reasons one cannot rely on year-to-year changes. These include the timing of reports and changes in policy and practice.
Timing
According to CM 2023 (and previous reports), “The child fatality count in this report reflects the federal fiscal year (FFY) in which the deaths are determined as due to maltreatment. The year in which a determination is made may be different from the year in which the child died.” The authors go on to explain that it may take more than a year to find out about a fatality, gather the evidence (such as autopsy results and police investigations) to determine whether it was due to maltreatment, and then make the determination. Alabama, for example, explained in its commentary that the deaths reported in a given year may have occurred up to five years before.
To add to the uncertainty around timing, the writers of CM 2023 are not exactly correct when they state that all states report on the fatalities determined in the reporting year. In their annual submissions to NCANDS, several states add fatalities for the previous year, implying that their practice is to report on fatalities that occurred in a specific time period, not those determined in the applicable year. Four states revised their number of 2022 fatalities in their submissions to CM2023. This suggests that their 2023 reports are in turn incomplete and will be revised in succeeding years. California, for example, explained that:
Calendar Year (CY) 2022 is the most recent validated annual data and is therefore reported for FFY 2023. It is recognized that counties will continue to determine causes of fatalities to be the result of abuse and/or neglect that occurred in prior years. Therefore, the number reflected in this report is a point in time number for CY 2022 as of December 2023 and may change if additional fatalities that occurred in CY 2022 are later determined to be the result of abuse and/or neglect.
So California is reporting (for CM 2023) a truncated count of child maltreatment deaths for Calendar Year 2022. But it did add 12 fatalities to the count of fatalities that it reported for FFY 2022, raising its total from 164 to 176. California reported 150 fatalities for FY2023; one can assume that additional deaths will be reported in the next report. The four states together added 56 deaths for FFY 2023. Arizona’s total increased from 14 to 39, Maine from three to 10 and Virginia from 39 to 51. .
Policy and Practice: Fatality Definition and Measurement
In addition to timing issues, year-to-year changes in fatality counts can reflect changes in how states screen or define child maltreatment fatalities. In previous issues of CM, states have reported on improvements in their collection of fatality information. Over time, some states have eliminated obsolete practices in screening and information collection. West Virginia reported in its 2016 commentary that it had begun investigating child fatalities in cases where there were no other children in the home. North Carolina ended its restrictive policy of reporting only fatalities determined by a chief medical examiner to be homicide, and it also began efforts to incorporate vital statistics and criminal justice data.
During FY 2023, some states reported changes that may have resulted in a reduced number of child fatalities reported.
- Texas did not submit commentary for FFY 2023. But as reported above, it changed its screening policy so that reports involving a child fatality but include no explicit concern for abuse and neglect are not investigated if the reporter and other pertinent sources had no concern for abuse or neglect. DFPS reports that the number of child fatalities it investigated decreased from 997 in FY2022 to 690 in FY2023 (a 31 percent decrease) due to this new screening policy. And the number of child maltreatment fatalities fell from 182 to 164. But with a drastic drop in foster care placements in Texas, there is reason to fear that maltreatment fatalities increased rather than decreased. If that is the case, this change screening policy may have resulted in the failure to investigate and confirm actual maltreatment deaths..
- The Illinois Division of Child Protection reported that it added a new administrative review process for sleep-related deaths. A senior administrator reviews the investigation to ensure that death included evidence of “blatant disregard.” DCF links this new policy with a decrease of 24.6% in reported child fatalities in FFY 2023.
Other states reported changes that might result in an increased number of child fatalities reported. Maryland attributed an increase in reported fatalities to a policy change requiring local agencies to screen in sleep-related fatalities as part of its prevention effort. Alaska reported a change that may affect fatality counts in future years: in December 2023 the agency dropped its practice of screening out cases where no surviving children remained in the home; from now on the agency will be making maltreatment findings even when there are no surviving children.
It is regrettable that most state commentaries do not include explanations for the changes in their reported number of referrals, reports, and victims. Worse, several states do not even submit commentaries in time to be included in each year’s report. In CM023, commentaries are missing for Arizona, Hawaii, Kansas, New Hampshire, North Carolina, Oregon, Texas, and West Virginia. Given the importance of the state commentaries for understanding the data they submit, the preparers of the CM reports should reach out to agency personnel in states that have not submitted commentaries by a certain date or have not answered the important questions and ask the questions directly directly. This information is too important to be left out.
It is unfortunate that ACF continues to misuse term “victimization” and “victimization rate” to suggest that child maltreatment (including fatalities) is declining, particularly in its press release and executive summary, which do not provide any explanation of the true meaning of the terms. The deceptive language is not a surprise given the previous Administration’s desire to take credit for ostensible and support the prevailing narrative regarding the need for a reduction in interventions with abusive and neglectful families. One does not have to be a statistician or data scientist to realize that we will never get an accurate measure of child maltreatment because so much of it occurs behind closed doors. Finding fewer victims is one way to reduce CPS intervention in the lives of vulnerable children–and to deny that the reductions are harmful. Sadly, this report will be used as evidence to support policies that continue to roll back protections for our most vulnerable children.
Notes
- Substantated is defined as “supported or founded by state law or policy.” “Indicated” is a less commonly used term meaning a “disposition that concludes maltreatment could not be substantiated understate law or policy, but there is a reason to suspect that at least one child may have been maltreated or is at risk of maltreatment.” ↩︎
- An “alternative response” includes an assessment and referral to appropriate services if the parent agrees to participate. There is no determination on whether abuse or neglect occurred and no child removal unless the case is transferred to the investigative track. ↩︎
- Theodore Cross and Cecilia Casanueva, “Caseworker Judgments and Substantiation,” Child Maltreatment, 14, 1 (2009): 38-52; Desmond K. Runyan et al, “Describing Maltreatment: Do child protective services reports and research definitions agree?” Child Abuse and Neglect 29 (2005): 461-477; Brett Drake, “Unraveling ‘Unsubstantiated,’” Child Maltreatment, August 1996; and Amy M. Smith Slep and Richard E. Heyman, “Creating and Field-Testing Child Maltreatment Definitions: Improving the Reliability of Substantiation Determinations,” Child Maltreatment, 11, 3 (August 2006): 217-236. ↩︎
- Brett Drake, Melissa Jonson-Reid, Ineke Wy and Silke Chung, “Substantiation and Recidivism,” Child Maltreatment 8,4 (2003): 248-260; Jon M. Hussey et al., “Defining maltreatment according to substantiation: Distinction without a difference?” Child Abuse and Neglect 29 (2005): 479-492; Patricia L. Kohl, Melissa Jonson-Reid, and Brett Drake, “Time to Leave Substantiation Behind: Findings from a National Probability Study,” Child Maltreatment, 14 (2009), 17-26; Jeffrey Leiter, Kristen A. Myers, and Matthew T. Zingraff, “Substantiated and unsubstantiated cases of child maltreatment: do their consequences differ?” Social Work Research 18 (1994): 67-82; and Diana J. English et al, “Causes and Consequences of the Substantiation Decision in Washington State Child Protective Services,” Children and Youth Services Review, 24, 11 (2002): 817-851. ↩︎
- Plans of Safe Care are voluntary plans offered to the families of substance-exposed infants under the Comprehensive Addiction and Recovery Act (CARA). ↩︎
- We. know this from child fatality reviews that many children who die have been the subject of previous referrals, which were not substantiated but later found in fatality investigations to have been correct. See discussions of the deaths of Thomas Valva and Gavin Peterson, for example. ↩︎