The federal Children’s Bureau (CB) has released its annual Child Maltreatment report, containing data provided by the states from Federal Fiscal Year 2018. The high rate of maltreatment victimization and the contrasting numbers and rates between states and populations are two of the major takeaways of the report. A common theme across the report is that differences between states and populations and over time can reflect differences in levels of maltreatment, policy or practice, or even how states collect data.
CB’s annual maltreatment reports use data from the National Child Abuse and Neglect Data System (NCANDS), which is a federal effort that collects and analyzes child welfare data provided voluntarily by the states plus the District of Columbia and Puerto Rico. The data follow children and families from referrals to reports, dispositions and services. One of the most helpful resources is exhibit 2, reproduced below, a flow chart that follows families and children through the process from referral to services. (All tables in this post are reproduced from the report).

Referrals and Reports
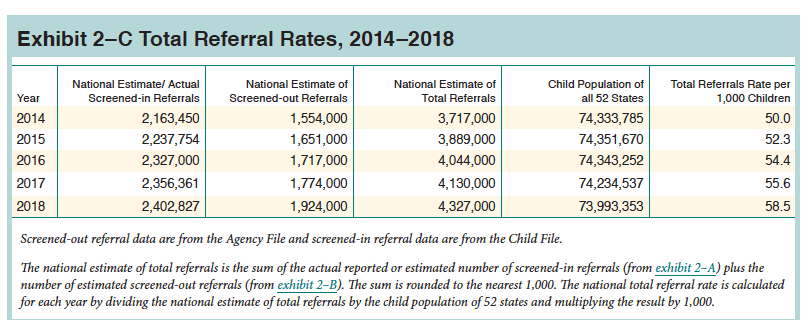
During FY 2018, states reported receiving a total of 4.3 million “referrals” (calls to a hotline or other communications alleging abuse or neglect) regarding approximately 7.8 million children. The number of referrals per 1,000 children varied wildly between states, from a low of 15.7 in Hawaii to a high of 167.9 in Vermont. The different referral rates between states may reflect different levels of knowledge about and comfort with child maltreatment reporting, different rates of underlying maltreatment, or even different state practices in defining the term “referrals.” Vermont explains that its high referral rate is the result of its practice of treating all calls to the child abuse hotline as referrals.
The rate of referrals has increased from 50 per 1,000 children in 2014 to 58.5 referrals per 1,000 children in 2018. Differences over time within a state may due to changes in state policy or practice or events in a particular state. For example, Alabama reported that it implemented online mandatory reporter training in 2014, resulting in an increase in referrals. Rhode Island reported a large increase in referrals due to the public trial of a school official for failure to report child abuse, resulting in more than a doubling of hotline calls from school staff.
A referral may be screened in or out by the child welfare agency depending on whether it meets agency criteria. Referrals may be screened out because they do not meet the definition of child abuse and neglect, there is inadequate information, or for other reasons. Screened-in referrals are called “reports” and receive a traditional CPS investigation or an “alternative response” (often called an “assessment”) in states that have two-track or “differential response systems.” These alternative responses, usually reserved for the less serious cases, do not result in an allegation of abuse or neglect but rather are aimed at connecting families with services they might need. Of the 4.3 million referrals, states screened in 2.4 million for an investigation or assessment. The rate of screened-in referrals (known as “reports”) has increased from 29.1 per 1,000 children in 2014 to 32.5 in 2018. The highest number of reports came from education personnel (20.5%), legal and law enforcement personnel (18.7%), and social services personnel (10.7%). Parents, other relatives, friends and neighbors submit the remaining reports.
Substantiations
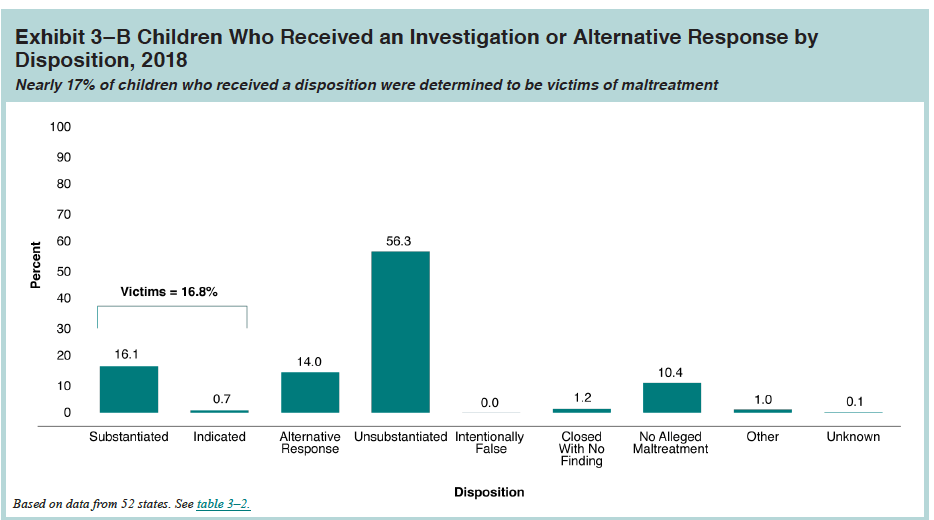
A total of 3.5 million children received an investigation or alternative response, and states found approximately 678,000 (16.8%) to be victims of child maltreatment; in other words the allegation was “substantiated.” Another 14% received an alternative response rather than an investigation, which meant there was no determination of whether maltreatment occurred. Reports involving 56.3% of these children were unsubstantiated, which meant there was not sufficient evidence to conclude that maltreatment took place.
The 678,000 children who were found to be victims of maltreatment equates to a national rate of 9.2 victims per thousand children in the population, or almost one out of every 100 children. This rate varies greatly by state, from 2.7 in Washington 1 to 23.5 in Kentucky. A lower child victimization rate might reflect less child maltreatment or a system less likely to respond to existing maltreatment or that makes greater use of differential response. Kentucky had the highest proportion of children found to be victims (23.5 per 1000 children or over one in every 50 children) followed by West Virginia, Rhode Island, Massachusetts and Michigan. The ongoing crisis involving opioid and methamphetamine addiction has been blamed for an increase in maltreatment in many states. And indeed, all of the states with the highest rates have been hard-hit by the opioid epidemic and had among the highest opioid overdose death rates in the country in 2017.
The national proportion of children found to be victims of maltreatment has fluctuated since 2014, increasing slightly between 2014 and 2018 from 9.1 to 9.2 per thousand. This small national increase masks large changes in the numbers of victims in certain states, from a 50% decrease in Georgia to a 216% increase in Montana. In their written submissions, the states attribute these diverse trends to changes in child welfare law, policy and practice as well as increases in parental drug abuse and even severe weather events such as Hurricane Maria in Puerto Rico.2 Georgia reports a policy change that resulted in a large increase the proportion of cases assigned to the alternative response track, perhaps one reason for the decrease in substantiations. Montana has experienced a surge in children entering foster care due to parental drug abuse, especially methamphetamine, which probably contributed to the increase in children found to be victims.
The disparity in the proportion of children found to be maltreatment victims across states is consistent with the belief that there is no foolproof method of assessing the truth of an allegation and that substantiation may not be a very good indicator of whether maltreatment has taken place. Research has found little or no difference in future reports of maltreatment of children who were the subject of substantiated or unsubstantiated reports.

Victim Demographics
The proportion of children found to be victims of maltreatment decreases as age increases. The rate of substantiated victimization for babies under a year old is 26.7 per thousand. This rate falls to 11.8 percent for children aged one to two and decreases gradually as age increases. This age effect reflects the greater fragility and helplessness of younger children and also the fact that they are less likely to spend time away from their parents (the primary maltreaters). That is one reason why many child advocates support making early care and education available to all children at risk for maltreatment and particularly to those already involved with the child welfare system.
 The rate of children found to be victims of maltreatment varies considerably between racial and ethnic groups. The highest rate is for Native American or Alaska Native children, who were found to be victims at a rate of 15.2 per thousand, followed by African-American children, with a rate of 14 per thousand, compared to 8.2 per thousand for White children, and 1.6 per thousand for Asian children. It is 8.1 per thousand for Hispanic children, who can be of any race. The higher rate of substantiated victimization among African-American and Native American children is a subject of controversy. Some believe it reflects greater tendency of African-American and Native parents to be reported to CPS and later substantiated as perpetrators due to racism. But these differences might also reflect a greater poverty rate for Black and Native children, or cultural factors, such as a preference for corporal punishment in the Black community, or substance abuse in the Native American community.
Maltreatment Types
Neglect continues to be the predominant type of maltreatment. The data shows 60.8% of children were found to be victims of neglect only, 10.7% victims of physical abuse only, and 7.0% to be sexually abused only, with 15.5% suffering from multiple types of maltreatment, mostly commonly neglect and physical abuse. It is important to understand that a given child may be found to have suffered one type of maltreatment when other types are also present. For example, abuse can be hard to substantiate when the parent and child give contradictory accounts, or the child recants, and such children may be substantiated for neglect only when abuse is also present.
For the first time, 18 states reported on victims of sex trafficking. These states reported a total of 339 victims. While one case would be too much, it is encouraging that the scope of the problem is so small compared to other types of maltreatment. This suggests that sex trafficking as a type of child maltreatment is much less widespread than one might have thought given the amount of attention recently attached to this topic through legislation, training, and policy.
There is wide variation among states in the prevalence of different types of substantiated maltreatment. Some of this variation may be due to real underlying differences in parental behavior and some may be due to varying laws, policies and practices. Of particular interest are the states that have much higher percentages of abuse than the national average. While nationally only 10.7% of victims are found to have experienced abuse only, that percentage was 55.3% in Vermont, 48.2% in Alabama, and 39.7% in Pennsylvania. It is known that corporal punishment, which may escalate to abuse, is more popular in Southern states, like Tennessee and Alabama. Vermont’s and Pennsylvania’s high rates of abuse may be due to the assignment of many less-serious cases to an alternative track where there is no disposition (in Vermont) or the disposition is not reported (in Pennsylvania).3 Alabamans are aware of their state’s high abuse rate, which was covered in an excellent story by Al.com that cites the state’s acceptance of corporal punishment as one underlying factor.
Substance Abuse
For the FY 2018 report, the researchers analyzed three years of data on the presence of alcohol or drug abuse among caregivers. They found that the national percentage of substantiated victims with a caregiver identified as a drug abuser was 30.7% in 2018. Alcohol as a caregiver risk factor was 12.3%. Both of these percentages increased slightly from 2016. As is often the case, there was an astonishing diversity among states, ranging from 2.2% to 45.5% for alcohol abuse, and from 3.1% to 61.5% for drug abuse. This diversity, especially the very low rates in some states, raises concerns about whether they are accurately capturing these factors.
Perpetrators
The data show that 90.7% of the victims were maltreated by one or both of their parents. That includes nearly 40% who were maltreated by their mother acting alone and 21.5% by their father acting alone. Relatives (4.7%) and unmarried partners of parents (2.8%) are the largest remaining categories of maltreaters.
Fatalities
There is no standard, mandatory system for reporting child abuse and neglect deaths and it is often extremely difficult to determine where a death was caused by abuse or neglect rather than natural causes. Based on data from all states except Massachusetts, the researchers estimated that 1,770 children died from abuse or neglect in 2018, which is a rate of 2.39 per 100,000 children in the population. That is an 11.3% increase over the estimate for 2014 but this change may reflect data quality rather than a real change in maltreatment deaths. State rates range from 0 (Nebraska) to 6.6 (Arkansas) per 100,000 children but it is hard to know how much of the variation reflects differences in capturing actual child fatality rates. NCANDS maltreatment data are generally viewed as underestimates because, among other factors, many maltreatment fatalities may be unknown to any system or impossible to prove and some states do not report on deaths of children not known to the Child Protective Services Agency. In contrast, the Commission on Child Abuse and Neglect Fatalities reported that the most recent National Incidence Study (where data is collected directly by ACF) reported 2,400 deaths compared to 1,530 deaths in the Child Maltreatment report for a similar period. The CAPTA reauthorization bill which was passed by the House would require the Secretary of the Department of Health and Human Services establish uniform standards for the tracking and reporting of child fatalities and near-fatalities related to maltreatment. This requirement is badly needed.

Like child maltreatment itself, child maltreatment fatalities are more likely occur to the youngest children. Infants under one year old were the most likely to die, at a rate of 22.77 per 100,000. The rate decreases to 6.3 per 100,000 one-year-olds and continues to fall with age. Nearly half of the children who died were younger than one and 70.6% were younger than three. This illustrates again why it is so important to ensure that all children at risk of severe abuse or neglect must be in early care or education.

The child fatality rate for African American children (5.8 per 100,000 children) is over 2.8 times the rates for White children. Mixed-race children had the second highest rate of 3.2, followed by Native American children at 3.12. As discussed above, we do not understand these disparities. They could be due to cultural factors, economic factors, racism in reporting and substantiation, or other factors. The child maltreatment fatality rate for Black children is more than twice that for White children (5.48 vs. 1.94 per 100,000). This is an even greater disparity than the difference in child maltreatment rates (14.2 per 1000 for black children vs. 8.2 per 1000 for white children). Perhaps many Black parents’ embrace of corporal punishment, as described by author Stacey Patton in her important book, Spare the Kids, while not much different in terms of overall percentages from that of White parents, countenances more severe discipline than among other racial and ethnic groups. These disparate child maltreatment death rates should give pause to those self-described anti-racists who want to equalize the rates of investigations, substantiations, and child removals of Black and White children. Such a policy would very likely lead to increased deaths of Black children–hardly an outcome they should welcome.

Of the children who died from maltreatment in 2018, 72.8 percent suffered neglect and 46.1 percent suffered physical abuse, including some children who suffered more than one type of maltreatment. Eighty percent of the deaths were caused by parents or caregivers acting alone or with other individuals. Based on reports from 24 states, 20.3% of the children who died had received family preservation services in the previous five years. And 2.5% had been reunified with their families in the previous five years after being removed.
Services
Approximately 1.3 million children (a duplicated count4) received services at home or in foster care as the result of an investigation or alternative response. This includes 60.7% of the children who were found to be victims of maltreatment and 20.9 percent of the non-victims. It is concerning that such a low percentage of the victims received services. But not every state reports data for every in-home service (especially those provided by other agencies or contractors), so the actual proportion receiving services other than foster care may be higher. Sadly, according to reports from 26 states, only 21.9% of the victims received court-appointed representatives.
About a fifth of the children found to be maltreatment victims (22.5%) and 1.9% of those not found to be victims5 were placed in foster care. It is worth noting that less than half of the maltreatment victims who received services (146,706 out of 391,661) were placed in foster care. The others received family preservation services while remaining at home. Many news reporters and child welfare commentators have incorrectly suggested that no services other than foster care were available to abused or neglected children before the implementation of the Family First Prevention Services Act. This data shows the incorrectness of that assumption.
Infants with prenatal substance exposure
For FFY 2018, States were required to report for the first time on infants exposed prenatally to drugs and alcohol. Forty-five states reported that they had been informed of 27,709 infants born exposed to substances. Nearly 88% of these infants were screened in as appropriate for an investigation or alternative response. It is somewhat concerning that the others were not, given the possible serious effects of prenatal and postnatal substance abuse. Of those screened in, 75.5% had a caregiver identified as a drug abuser, 11.7% had a caregiver identified as a drug and alcohol abuse, and less than one percent had a caregiver identified as abusing alcohol only. The 24,342 children who were screened in in 42 states constituted a shockingly high 10.8 percent of children under one in those states. Of the screened in reports, 68.3 percent were substantiated as victims or abuse or neglect. Nine percent received an alternative response and nine percent were unsubstantiated. The report’s authors caution against comparing states because this was the first year of reporting. The wild disparity between states in the proportions identified suggests they are right to be cautious and that the national figures have a wide margin of error as a result.
The Child Abuse Prevention and Treatment Act (CAPTA) as amended by the Comprehensive Addiction and Recovery Act (CARA) in 2016, requires that all infants “affected by a substance abuse or withdrawal symptoms resulting from prenatal drug exposure, or a Fetal Alcohol Spectrum Disorder” receive a “plan of safe care…addressing the health and substance use disorder treatment needs of the infant and affected family or caregiver.” Thirteen responding states reported that 64% of infants with prenatal substance exposure had a plan of safe care. A separate CAPTA provision requires states to report how many infants had a “referral to appropriate services,” and fourteen states reported that only 42.6% of infants had such a referral. The difference between these two percentages is due to California, which provided data on referrals and not plans of safe care. Only 12.7% of California’s substance-exposed infants had referrals to appropriate services. Since the California’s population is larger, and the percentage receiving referrals was low, the overall percentage was reduced significantly by adding California but the two percentages were the same in the other responding states.
Plans of safe care and referrals are voluntary and do not mean much unless they are followed by the families, providers, and agencies. It would be better to know how many of these infants received foster care and other services after an investigation or family assessment. That would probably require opening a services case for all these families. Congress should consider requiring this, as it would be the only way to follow up on what services these families actually receive.
The fact that almost one in 100 children is found to be a victim of child maltreatment should be of concern to all child advocates, especially because it is likely that many other victims were never reported or found to be victimized. It is hard to interpret comparative data between states, populations, and years because of the difficulty in disentangling the amount of actual maltreatment given the variety of policies and practices in how it is defined and reported. Analysis of the report suggests changes in CAPTA that would make it more useful. For example, Congress should to set uniform standards for reporting child maltreatment fatalities by passing the CAPTA reauthorization bill in 2020. And the new version of CAPTA should be further strengthened to replace the plans of state care with a more substantial response to infant substance exposure.
- Pennsylvania’s victimization rate was actually the lowest at 1.8% but this low rate reflects the state’s unusual child protective services structure. Allegations that do not concern abuse or specific very serious types of neglect are labeled as General Protective Services and not counted as referrals or reports for federal reporting. ↩
- Puerto Rico had a 43% decline in children found to be maltreatment victims between 2014 and 2018. The territory’s commentary explains that its child population was already decreasing due to emigration even before Hurricane Maria struck in October 2017 and then further declined due to emigration. ↩
- Vermont’s extremely high abuse rate rate may be due to the fact that about 40% of its cases are assigned to the alternative response track, which does not result in a disposition, and another sizeable group are assigned to a pathway outside CPS, called family assessment. The cases assigned to these alternative tracks are expected to be less serious and more likely to involve neglect rather than abuse. A similar phenomenon likely occurs in Pennsylvania where most neglect allegation are assigned to General Protective Services and not reported to the federal government. ↩
- Individual children were counted more than once if they were involved in more than one CPS case. ↩
- Many of these children were probably siblings of children who were found to be victims of maltreatment. ↩

2 thoughts on “Child Maltreatment 2018: Almost one in 100 children found to be maltreated, but great variation among states and populations”