Maltreatment Reports, Victims and Fatalities All Down in 2024, reported The Imprint upon the release of the new federal report, on child maltreatment data for Federal Fiscal Year 2024. In my last post, I showed how the child fatality numbers from that report are too flawed to allow a conclusion that child deaths decreased. Five states account for over 100 percent of the decline in child maltreatment fatalities reported by the states for FFY 2024. All of these states have acknowledged that the declines in fatalities that they reported for FFY 2024 reflected changes and errors in how child maltreatment deaths were counted, not real trends in child maltreatment fatalities. But could it be that the number of reports and child maltreatment victims are more accurate than the fatality counts, which are based on smaller and more unstable numbers? The evidence suggests that these declines are also too heavily influenced by state policy and practice changes to be taken as true indicators of actual maltreatment trends.
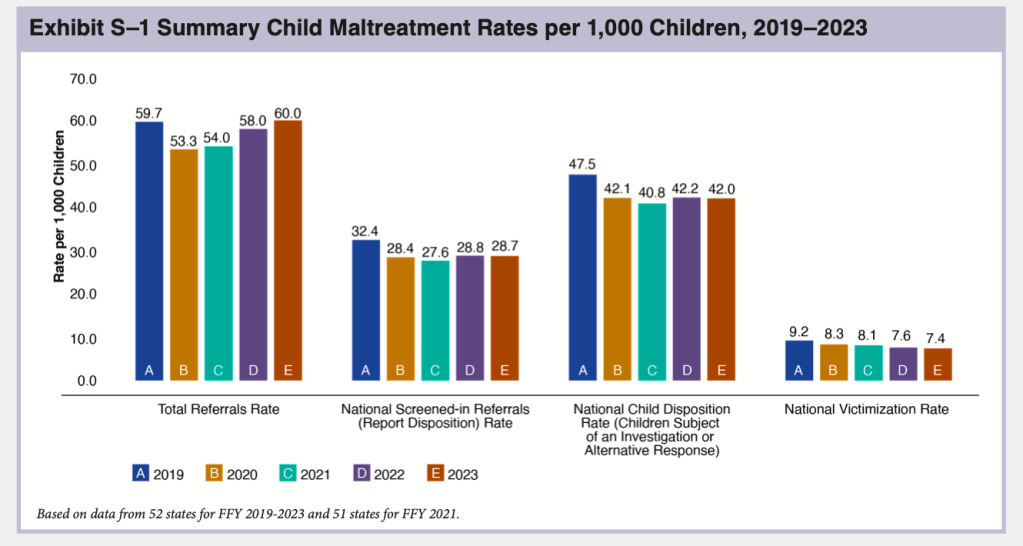
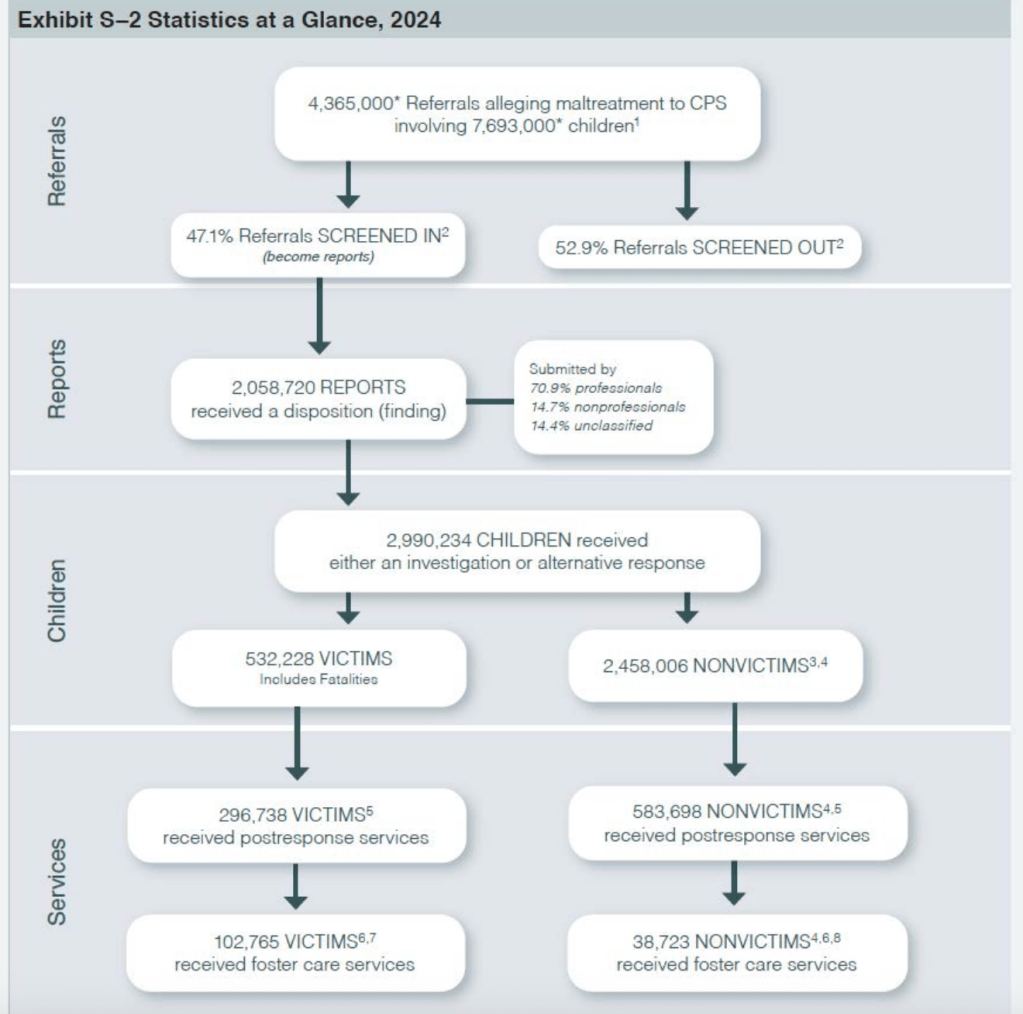
The annual Child Maltreatment reports, produced by the Children’s Bureau of the US Department of Health and Human Services, are based on data that states submit to the National Child Abuse and Neglect (NCANDS) data system. The new report, Child Maltreatment 2024 (CM2024), provides data for Federal Fiscal Year (FFY) 2024, which ended on September 30, 2025. Exhibit S-2 summarizes the findings of the newest report. Child welfare systems operate somewhat like a funnel, at each stage selecting a fraction of the cases or children to proceed to the next stage.. Child welfare agencies received 4.365 million “referrals” alleging maltreatment and “screened in” 47.1 percent of them as “reports,” of which 2,058,720 reports received an investigation or alternative response. The investigations resulted in a total of 532,228 children determined to be victims of child abuse and neglect.1
In discussing each stage of the child protective services process, CM2024 follows the regular practice in these reports of showing the changes in key indicators over time for the five years leading up to and including FFY 2024. But 2020-2024 is an unfortunate period to feature, given the onset of the COVID-19 pandemic in 2020. A more thoughtful approach would have been to start from 2019 or an earlier year before the onset of the pandemic. That approach would allow the observation of trends before they were interrupted by the pandemic. To facilitate such observation, I have provided charts of the changes in key indicators between 2015 and 2024, using the five-year trend data provided in CM 2019 and CM 2024.
Referrals
NCANDS uses the term “referrals” to mean reports to child welfare agencies alleging maltreatment. According to CM 2024, child welfare agencies received an estimated total of 4,365,000 referrals, or 59.3 referrals per 1,000 children, through their child abuse hotlines or central registries in that year. The number is an estimate because the states do not provide data on the total number of referrals, only on the number that were screened in and (usually) the number that were screened out. But not all states are able to provide the number of screened-out referrals; there were five jurisdictions that were not able to do this in FFY 2023 and FFY 2024, and more in earlier years.2 To estimate the total number of referrals nationally, the Children’s Bureau imputes numbers for the nonresponding states based on the national referral rate for the responding states.3
A state’s referral rate depends on what referrals it actually counts. The state-by-state tables for 2024 document large differences in referral rates, from 19.2 per 1,000 children in Hawaii to 169.1 per 1,000 in Vermont–also the top and bottom states in 2023. Vermont’s Department of Children and Families reports that the state is unique because its juvenile justice system is integrated with its child welfare system; The hotline handles calls about juvenile delinquency, truancy and other non-maltreatment concerns, helping to account for its high number of referrals.4 Connecticut reports that none of the calls that are assigned to alternative response are included in NCANDS, resulting in a lower number of rererrals than many states report. Hawaii does not submit commentary so reasons for its very low referral rate are unknown.
As shown in Chart 1, the total referral rate had been increasing until the onset of the pandemic in 2020, when it fell sharply; it then rose only slightly in 2021. It increased for the next two years, almost reaching its pre-pandemic level in 2023. In FFY 2024, the estimated number of referrals decreased slightly from 4.380 million to 4.365 million, and the referral rate decreased from 59.4 to 59.3 per 1,000 children.
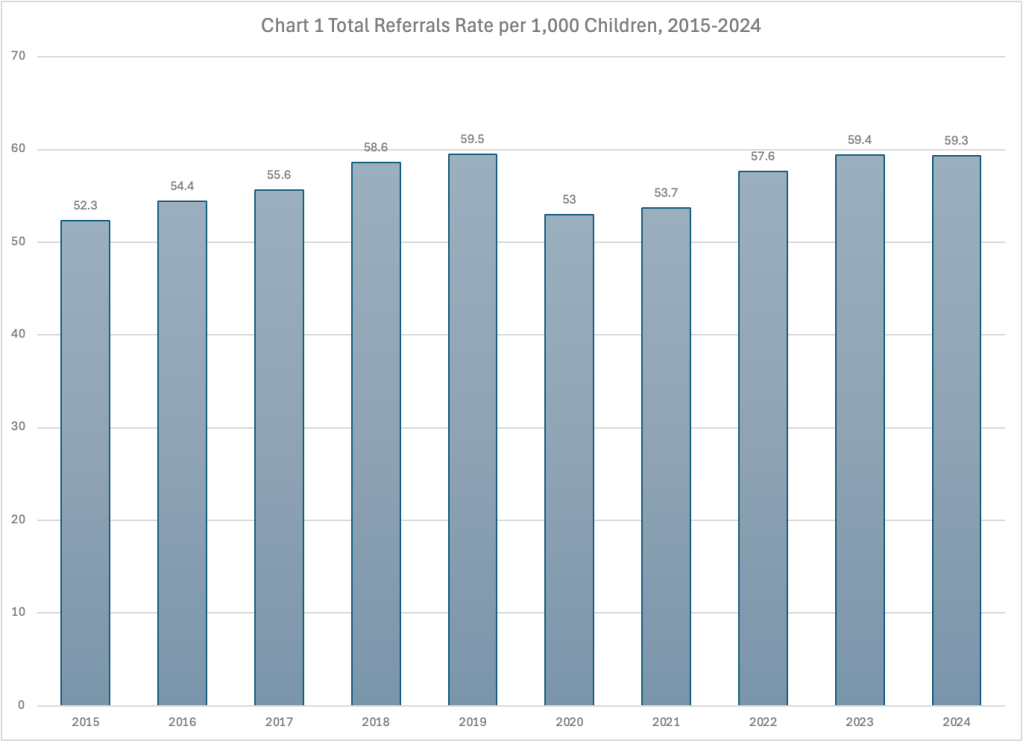
Source: Child Maltreatment 2019 and Child Maltreatment 2024, Exhibit S-1.
The very small decrease in the referral rate between 2023 and 2024 could have been caused by changes in policy, practice, and the types of messaging coming fom child welfare agencies, state officials and advocates around mandatory reporting of child abuse and neglect. State legislators, agency heads and advocates have recently worked to discourage calls to their child abuse hotlines based on the prevailing belief that many of these calls do not concern maltreatment but rather poverty and are often influenced by bias against parents of color. Agencies have been revising their mandatory reporter training5 to discourage reporting of concerns that are allegedly about poverty rather than child abuse or neglect. Implicit bias training is often included based on the belief that mandatory reporters are influenced by racial, cultural and class bias. In some states, “warmlines” are being set up to accept calls that are allegedly related to poverty rather than child maltreatment.6 Some states have banned anonymous reports to child abuse hotlines on the grounds that such reports are frivolous and expose children and families to unnecessary trauma–an assertion that has been challenged by based on research showing that anonymous reports save children’s lives. Such bans passed by the legislatures in Texas and Arkansas took effect shortly before the beginning of FFY 2024. In Texas, the number of referrals fell from 249,283 in 2023 to 233,112 in 2024. In Arkansas, it fell from 63,732 to 57,371. (A ban on anonymous reporting has been signed by the Governor of New York State and will take effect next summer; we may see its effect in the following fiscal year.)
The changes in policy and practice related to mandatory reporting are related to a broader change in the ideological climate around child welfare. It is reflected in the 2018 Family First Prevention Services Act and similar legislation in many states. Among the tenets of this ideology are that child welfare is a racist family policing system, neglect allegations and findings reflect poverty rather than maltreatment, and that child welfare intervention does more harm than good for children. The prevalence of these beliefs among legislators and agency leaders has led to policy changes that affect not only reporting but the subsequent stages of screening and investigation.
Screening
Once a state agency receives a referral, it will be “screened in” or “screened out” by agency staff. In general, referrals are screened out if they are deemed not to contain an allegation of child abuse or neglect, contain too little information on which to act, are more appropriately assigned to another agency, or for some other reason do not fall under the mandate of the child welfare agency. In NCANDS, a referral becomes a “report” once it is screened in. “Reports” are assigned for an investigation or “alternative response.”
The Children’s Bureau, as it does every year, chooses to show screened-in referrals divided by the child population, calling the result the National Screened-In Referrals Rate. This is an ambiguous indicator that reflects both the number of referrals and the proportion of those that are screened in. It is more useful to look at the percentage of referrals that an agency decides to screen in, which is an indicator of its willingness to intervene with families to protect children. Unfortunately, the the lack of screened-out numbers from some states makes this number an estimate because the total number of referrals in those states is unknown.7 Nevertheless, a clear pattern emerges when the percentage of referrals that were screened in between 2015 and 2024 is plotted in Chart 2. That percentage has decreased every year since 2015, especially after 2017, with the decline continuing during and after the pandemic. Between 2017 and 2024, the percentage of referrals that were screened in dropped from 57.6 to 47.1.
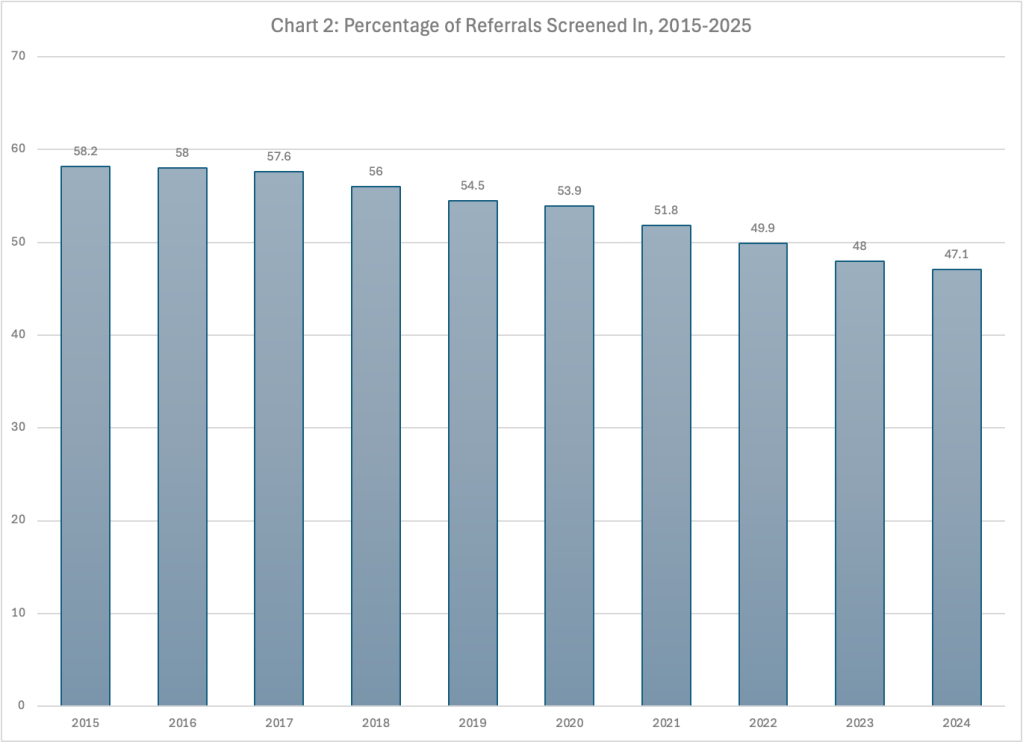
Source: Author’s Calculations from Child Matlreatment 2015, Child Maltreatment 2016, Child Maltreatment 2017, Child Maltreatment 2018, Child Maltreatment 2019, and Child Maltreatment 2024. These numbers are based on screened-out referral rates for 44 states in FFY 2015, 45 states in 2016, 2017, 2018, and 2019, 47 states in 2020 and 2022, and 46 states in 2021 and 2023. The states that did not report screened-out referrals in all ten years include New Jersey, New York, Pennsylvania, and North Dakota.
Some states with larger decreases in the number of screened-in referrals attributed them in their commentaries to more consistent screening processes with the implementation of centralized intake, more structured processes for determining if a report meets criteria for acceptance, or new screening tools such as a Structured Decision-Making model. Nebraska reports that in July 2023 it dropped a policy that was implemented in June 2019 that required the acceptance of all reports made by medical professionals about a child aged five or under. The state reports a modest decline in the number of screened-in referrals in the following year. Considering changes in the prevailing child welfare climate mentioned above, it is likely that other states made policy or practice changes designed to reduce the number of reports that were screened in.
National Child Disposition Rate
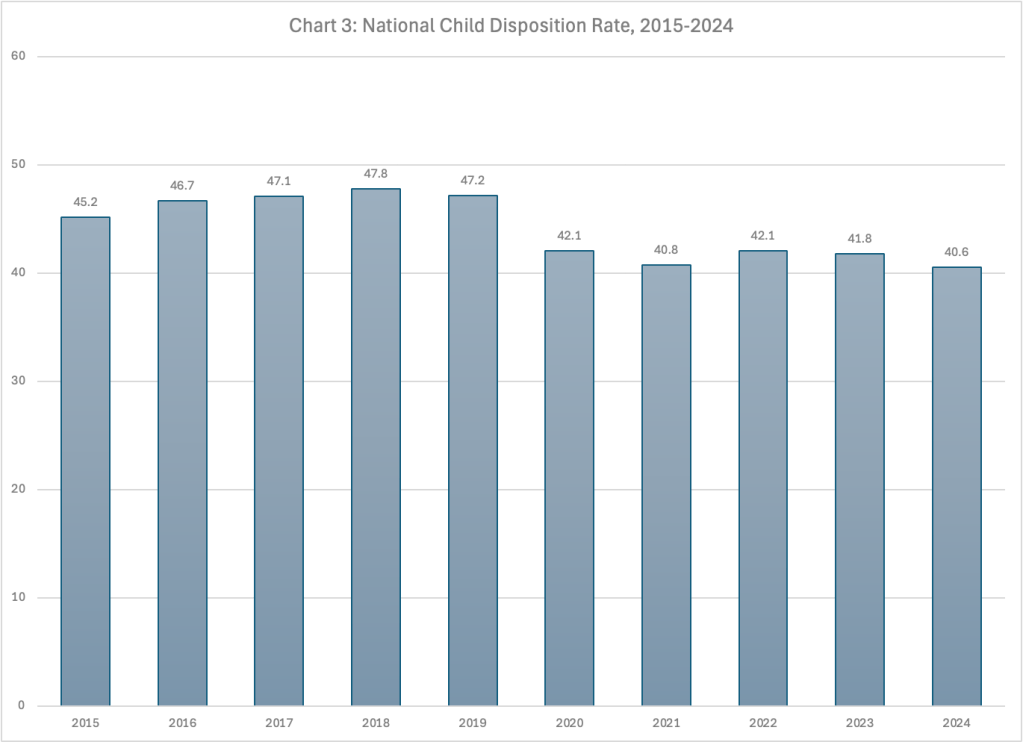
An informative rate reported by the Children’s Bureau is the “national child disposition rate,” which is the number of children subject to an investigation or alternative response. This rate is a good measure of the “footprint” of CPS–what proportion of children it touches. This rate ranges from 12.0 per 1,000 children in Hawaii (the lowest again) to a high of 90.4 per 1,000 in West Virginia–nearly one out of every ten children. The West Virginia rate, which has fallen significantly from the high of 148.8 in FFY 2019k presumably reflects the state’s substance abuse (particularly opioid) epidemic.
The National Child Disposition Rate rose from 2015 to 2019, falling drastically with the pandemic in 2020 and again 2021. In 2022 it was back to the 2020 level of 40.1 per 1,000 children, but then began declining. The pandemic may have masked what would have been an annual decline in this rate every year between 2018 and 2024. The proportion of children touched by CPS has dropped significantly since its high of 47.8 per 1,000 in 2018 to 40.6 in 2024. Given the lack of a decrease in referrals during that time period except for the very small decrease in 2024, this pattern must reflect the drop in the proportion of reports that were screened in over the period.
“Victimization”
Once a referral is assigned for investigation or alternative response, the next phase in the funnel is the determination of whether abuse or neglect has occurred, or in NCANDS parlance, whether the child is a “victim.” A “victim” is defined as “a child for whom the state determined at least one allegation of maltreatment was substantiated or indicated8; and a disposition of substantiated or indicated was assigned for a child in a report.” “Victims” include children who died of abuse or neglect if the maltreatment was verified. Those children who receive an “alternative response”9 instead of an investigation are not counted as victims because alternative response does not result in substantiation or “indication” of a report. The Children’s Bureau somewhat tautologically treats “alternative response” as one of the possible dispositions for children assigned to an investigation or alternative response.
As I explain every year (with apologies to my faithful readers), the number of “victims” reported by states does not represent the true number of children who experienced abuse or neglect, which is unknown. Many cases of child maltreatment go unreported. Children assigned to alternative response are not found to be victims unless their case is reassigned to the investigation track. And finally, substantiation may not be an accurate reflection of whether maltreatment occurred. Making a determination of whether maltreatment occurred is difficult. Adults and children do not always tell the truth, the youngest children are nonverbal or not sufficiently articulate to answer the relevant questions. So it is not surprising that research suggests that substantiation decisions are inaccurate10 and a report to the hotline predicts future maltreatment reports and developmental outcomes almost as well as a substantiated report.11
The vast difference in state “victimization rates” illustrates how these rates may reflect agency policy and practices as well as underlying rates of abuse and neglect. These rates range from a low of 1.2 per 1,000 children in New Jersey (even lower than Hawaii and even lower than last year’s rate of 1.5) to a high of 15.4 in Maine. It is unlikely that Maine has more than ten times more child abuse and neglect victims than New Jersey. “”Victimization rates” reflect what happens at earlier stages in the funnel of child welfare–reports, screening, and the use of alternative response to divert a child from the investigative track. They also reflect policies including different definitions of abuse or neglect and levels of evidence required to confirm maltreatment. They also state idiosyncracies in state systems: referrals concerning less serious neglect that are routed to General Protective Services in Pennsylvania do not appear at all in NCANDS. In Calendar Year 2024, the Pennsylvania Department of Human Services received 176,496 General Protective Services reports and only 41,070 Child Protective Services reports, so the overwhelming majority of referrals in Pennsylvania are not included in NCANDS In view of the deceptiveness of these terms, I have put the terms “victims” and “victimization rates,” when not qualified, in quotation marks in this post.
But what about changes over time? The fact that “victimization rates” reflect different policies and practices does not mean that trends over time don’t reflect real changes in the incidence of abuse and neglect. The national “victimization rate” declined in 2024 as it has done every year since 2018, even after the pandemic. It was down to 7.2 per 1,000 children in FFY 2024, compared to 9.2 per 1,000 children in 2018. Couldn’t this be good news about a decline in child abuse and neglect?
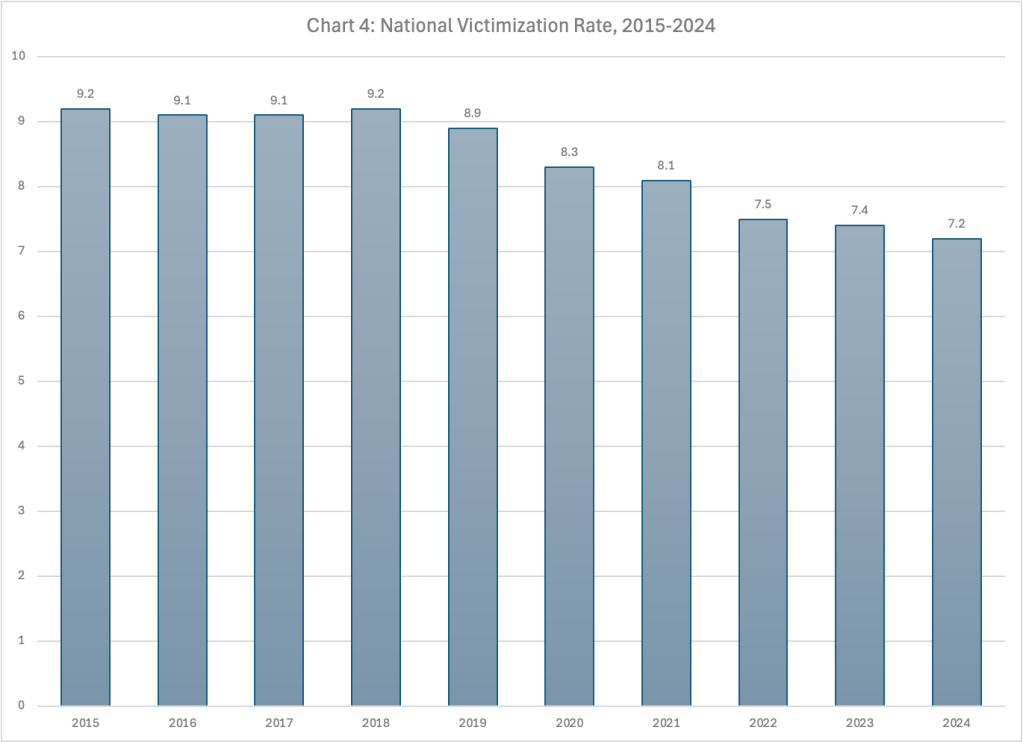
Victimization rates depend on screening decisions, and investigators’ decisions about whether a screened-in report will be substantiated as abuse or neglect. And these things can change over time. As mentioned above, recent changes have reflected the increasing prevalence of an ideology professing that child welfare involvement does more harm than good to children and families, and that agencies should scale back child removals into foster care and perhaps even in-home services. One way to do this is to make it more difficult to substantiate maltreatment, as New York and Texas (two states on the opposite ends of the political spectrum) have recently done. In Texas, the Legislature changed the definition of neglect to require both “blatant disregard” for the consequences of a parent’s action or inaction and either a “resulting harm or immediate danger.” New York changed the level of evidence required to substantiate an allegation of abuse or neglect from “some credible evidence” to “a fair preponderance of the evidence.” Both of these states mention these changes in explaining their declines in “victimization” counts.
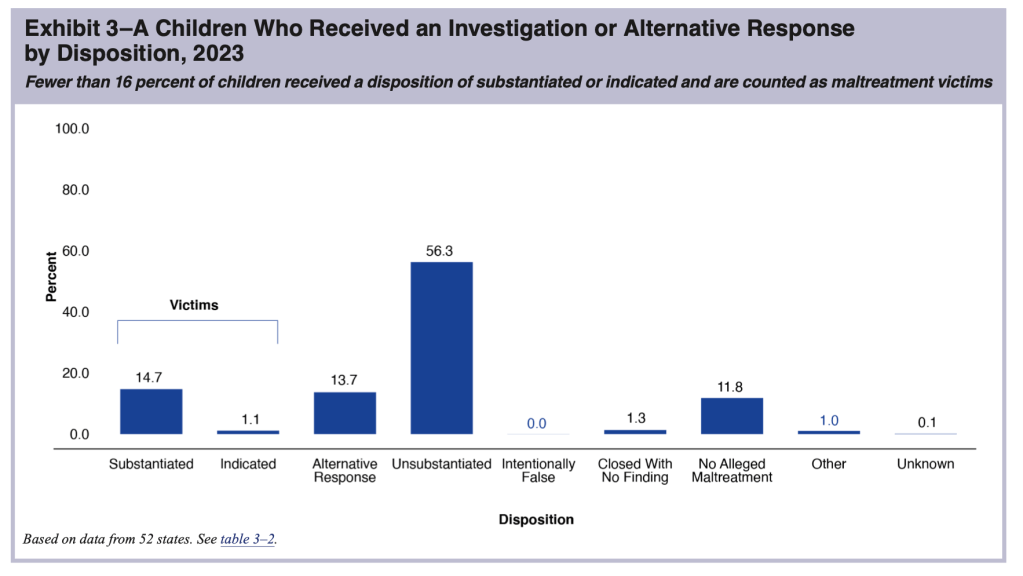
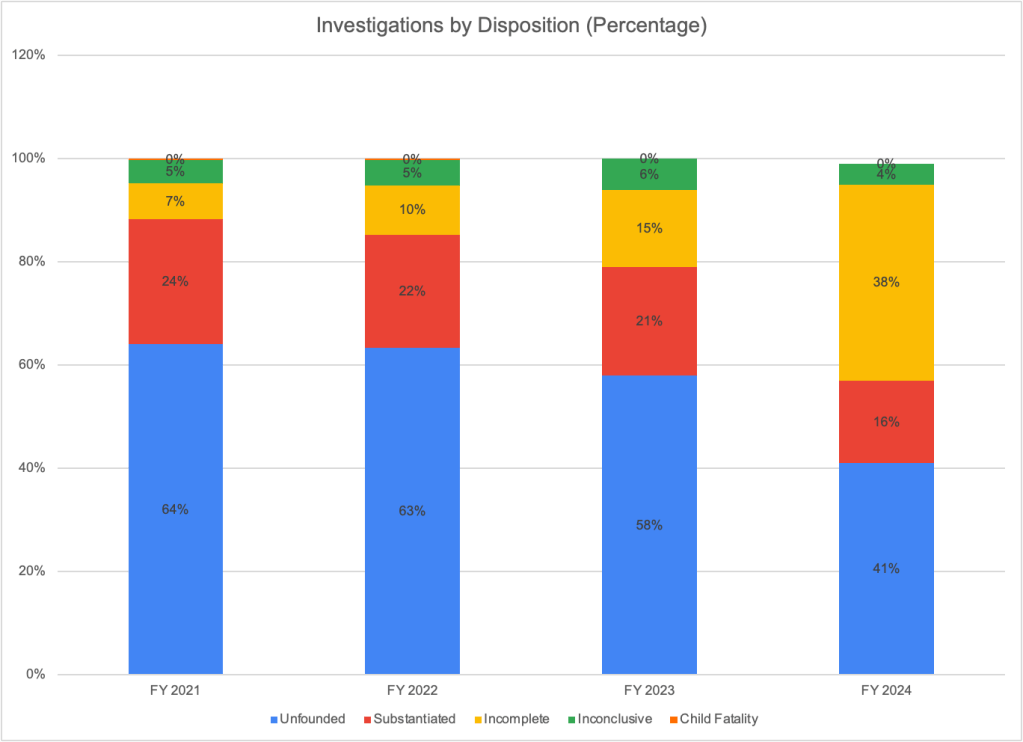
Surprisingly, plotting the number of children who received an investigation or alternative response by disposition (see Table 1) casts some doubt on opinion of states like New York and Texas that the decreased number of victims they found reflects state policies making it more difficult to substantiate maltreatment. The proportion of children judged to be victims of abuse or neglect dropped from 16.8 percent in 2018 to 15.8 percent in 2024. Yet the percentage of children who received a disposition of “unsubstantiated” hardly changed during the period, nor did the proportion of children receiving an alternative response. The only category that increased enough to account for the decrease in substantiations was a category called “no alleged maltreatment,” which increased from 10.4 to 11.8 percent of the children. According to CM 202412 that category would include children who are not the subject of an allegation but who are investigated because they live in a state that provides a response to all children in a family, even those who are not the subject of an allegation. It is not clear why the percentage of children in this category would have increased so much since 2018.
Table 1 Children who Received an Investigation or Alternative Response by Disposition (Percentage), FFY 2018-2024
| FFY | Victims (Substantiated/Indicated) | Alternative Response | Unsubstan-tiated | No alleged maltreatment | Other |
| 2018 | 16.8 | 14.0 | 56.3 | 10.4 | 2.3 |
| 2019 | 16.7 | 13.8 | 56.5 | 10.6 | 2.4 |
| 2020 | 17.6 | 13.2 | 56.4 | 10.4 | 2.4 |
| 2021 | 17.8 | 13.3 | 56.0 | 10.3 | 2.6 |
| 2022 | 16.1 | 13.9 | 56.3 | 11.1 | 2.5 |
| 2023 | 15.8 | 13.7 | 56.3 | 11.8 | 2.4 |
| 2024 | 15.8 | 13.9 | 56.2 | 11.8 | 2.2 |
Source: Child Maltreatment 2024, Child Maltreatment 2022.
The number and rate of child maltreatment referrals registered by states saw a small decline in Federal Fiscal Year 2024. This decline may reflect changed messaging from states regarding mandatory reporting of child maltreatment as much or more than a real reduction in concerns regarding children being maltreated. States report a declining number of child maltreatment victims as well, but it is not possible to say with any confidence that the number of victims and their proportion of the population decreased in FFY 2024 or in the past five or ten years. There are simply too many factors influencing these numbers and how they change over time, including recent changes in policy and practice by state child welfare agencies designed to reduce their intervention with families. Adding to the confusion is the existence of unexplained changes, such as the reduction in the percentage of children who received an investigation or alternative response with “no alleged maltreatment.” Sadly, Child Maltreatment 2024, like its predecessors, tells us little about the true state of maltreatment in America.
Note: This blog was edited on February 17, 2024 to incorporate information about the disposition category of “no alleged maltreatment” and also to add a mention of Pennslvania’s General Protective Services cases not being included in CM 2024. It was modified again on February 19, 2024 to add information provided by the Vermont Department of Children and Families about why it receives such a high number of referrals.
Notes
- Of those victims, 296,738 received some type of services, which are not discussed in this blog. ↩︎
- I use the term “states” to mean “jurisdictions,” including the District of Columbia and Puerto Rico. Four states were unable to report complete data for both FFY 2023 and FFY 2024: New Jersey, New York, North Dakota and Pennsylvania. West Virginia did not report complete data for FFY 2023 so its data could also not be used for a year-to-year comparison. ↩︎
- See CM 2024, page 11. ↩︎
- Email from Commissioner’s Office, Vermont Department of Children and Families, February 19, 2026. ↩︎
- See also DCYF Updates Mandatory Reporter Training (Washington), Family Experiences Shape Efforts to Reform Missouri’s Overburdened Foster Care System. ↩︎
- See A Phone lifeline for families in need in DC receives support from Doris Duke Foundation, Warmline offers alternative to calling protective services (Colorado). ↩︎
- See notes to Chart 2. ↩︎
- Substantated is defined as “supported or founded by state law or policy.” “Indicated” is a less commonly used term meaning a “disposition that concludes maltreatment could not be substantiated understate law or policy, but there is a reason to suspect that at least one child may have been maltreated or is at risk of maltreatment.” ↩︎
- An “alternative response” includes an assessment and referral to appropriate services if the parent agrees to participate. There is no determination on whether abuse or neglect occurred and no child removal unless the case is transferred to the investigative track. ↩︎
- Theodore Cross and Cecilia Casanueva, “Caseworker Judgments and Substantiation,” Child Maltreatment, 14, 1 (2009): 38-52; Desmond K. Runyan et al, “Describing Maltreatment: Do child protective services reports and research definitions agree?” Child Abuse and Neglect 29 (2005): 461-477; Brett Drake, “Unraveling ‘Unsubstantiated,’” Child Maltreatment, August 1996; and Amy M. Smith Slep and Richard E. Heyman, “Creating and Field-Testing Child Maltreatment Definitions: Improving the Reliability of Substantiation Determinations,” Child Maltreatment, 11, 3 (August 2006): 217-236. ↩︎
- Brett Drake, Melissa Jonson-Reid, Ineke Wy and Silke Chung, “Substantiation and Recidivism,” Child Maltreatment 8,4 (2003): 248-260; Jon M. Hussey et al., “Defining maltreatment according to substantiation: Distinction without a difference?” Child Abuse and Neglect 29 (2005): 479-492; Patricia L. Kohl, Melissa Jonson-Reid, and Brett Drake, “Time to Leave Substantiation Behind: Findings from a National Probability Study,” Child Maltreatment, 14 (2009), 17-26; Jeffrey Leiter, Kristen A. Myers, and Matthew T. Zingraff, “Substantiated and unsubstantiated cases of child maltreatment: do their consequences differ?” Social Work Research 18 (1994): 67-82; and Diana J. English et al, “Causes and Consequences of the Substantiation Decision in Washington State Child Protective Services,” Children and Youth Services Review, 24, 11 (2002): 817-851 ↩︎
- See page 23. ↩︎