by Marie Cohen
Complete Fiscal Year 2024 data now on the Dashboard of the District of Columbia’s Child and Family Services Agency (CFSA) reveal significant changes over the previous fiscal year. Most striking is a large jump in the number of incomplete investigations and a concomitant decline in “substantiated” and “unfounded” reports. The number of children entering foster care increased for the first time in over ten years. There was a drop in in-home case openings but a similar increase in foster care placements during the year. The agency did not respond to this writer’s questions about the meaning of these trends.
Referrals
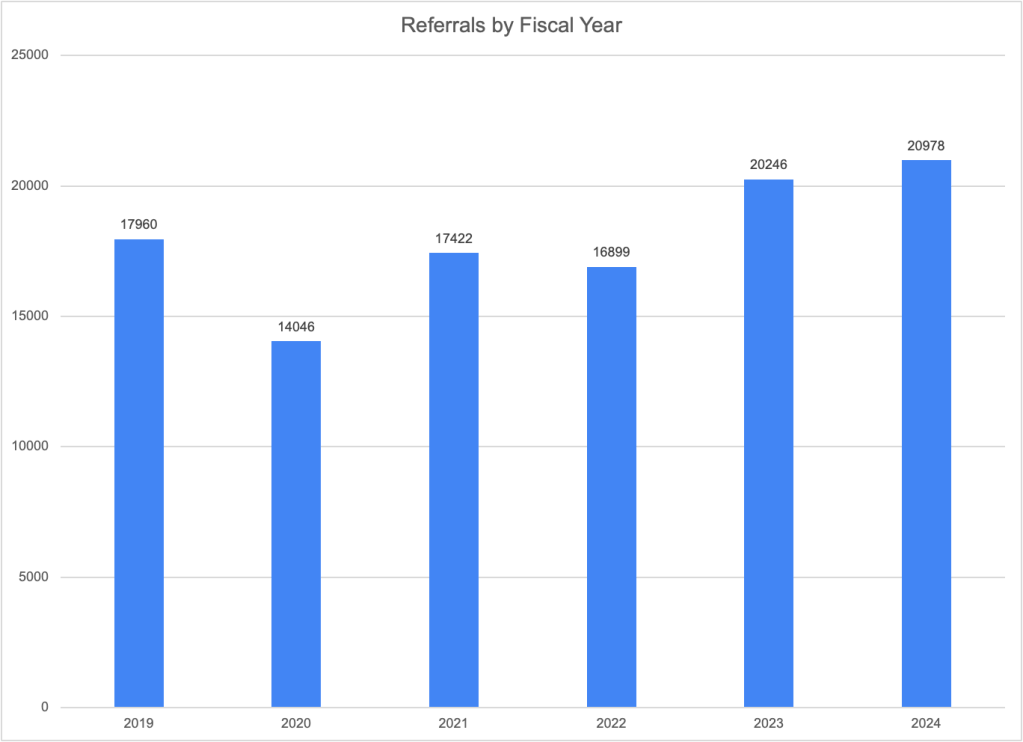
Total referrals (or calls to the CFSA hotline) have increased for the second year in a row. After falling in 2020 and remaining below 2019 levels in 2021 and 2022, the number of referrals jumped from 16,899 in FY2022 to 20,246 in FY2023 and then rose more modestly to 20,978 in 2024–an increase of 3.6 percent. Prominent child welfare scholars like Emily Putnam-Hornstein have concluded that referrals are the best available indicator of actual maltreatment due to the strong correlation between referrals and future reports (regardless of the outcome of any associated investigation) and also evidence of the difficulty of correctly determining whether maltreatment has occurred. Thus, the increase in referrals may well be a sign of increasing maltreatment. Contributing factors might be the end of COVID-19 assistance programs and the growing mental health, substance abuse, and housing crises in the District.
Childcare and school personnel continued to make more than half of the referrals to CFSA, with another 13 percent coming from law enforcement and 11 percent from friends and neighbors. All three of these groups made more referrals in FY2023 than FY2024, while counselors, therapists, social workers and medical professionals made fewer, suggesting that children may be seeing fewer of these professionals with the disappearance of virtual options spawned by the pandemic.

Looking at CFSA’s response to the referrals, the largest portion, or 73 percent, were screened out. That compares to only 19 percent that were accepted for investigation. The remaining referrals were either linked to an existing investigation (three percent) or classified as an information and referral that does not involve an allegation of abuse or neglect. These percentages are quite similar to those of the previous year.

Investigations
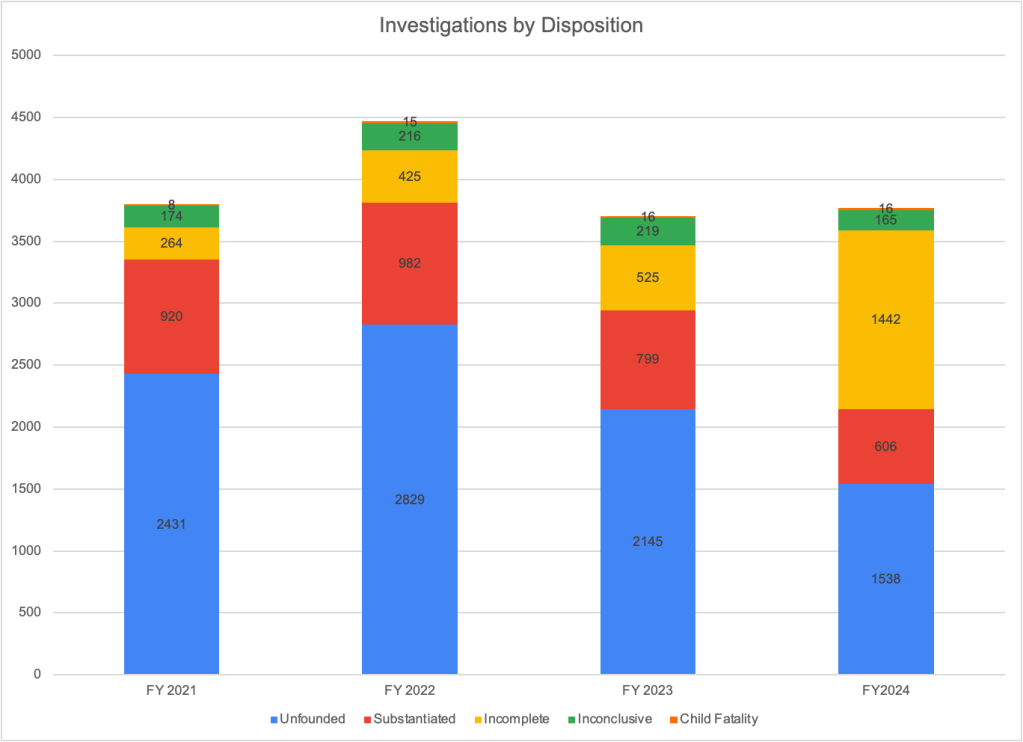
An investigation can have five different dispositions. According to the definitions provided in the Dashboard, unfounded means that there is not enough evidence to conclude that the child has been maltreated or at risk of being maltreated. “Substantiated” means that there is enough evidence to conclude that the child has been maltreated or is at risk of maltreatment. “Inconclusive,” means that “there is insufficient evidence to substantiate the report but there still exists some conflicting information that indicate the abuse or neglect may have occurred.” “Incomplete” means that the investigation could not be completed due to barriers like inability to locate the family, a family’s refusal of access to the home, or finding out that the family lived out of state.
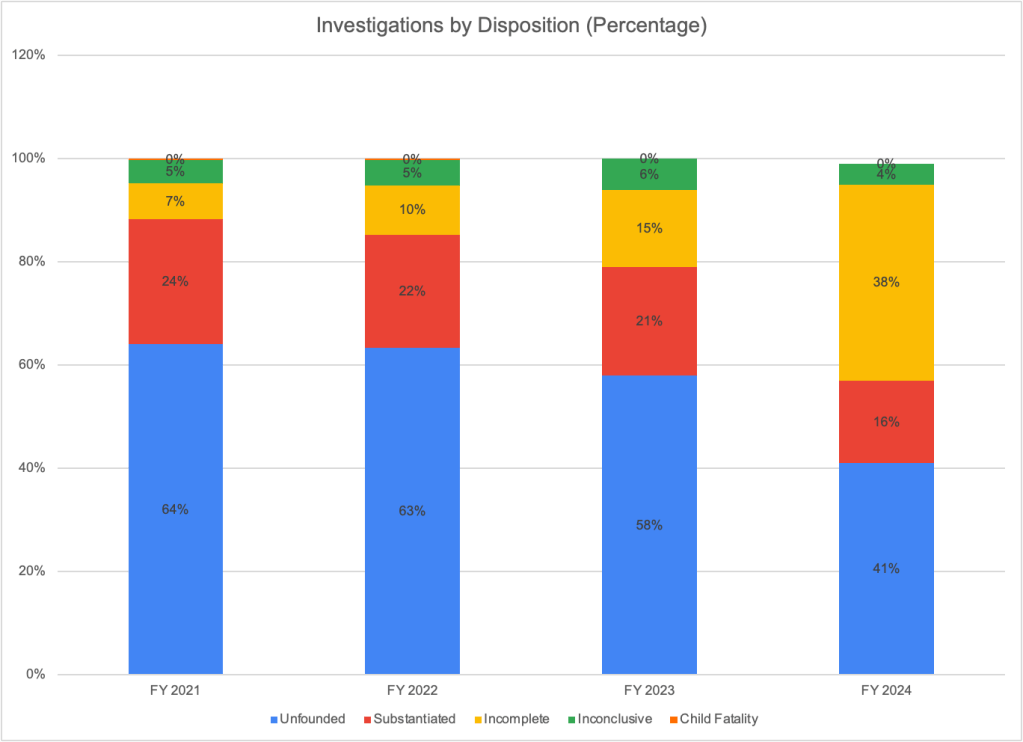
There was a big jump in the number of investigations categorized as incomplete, from 525 in FY2023 to 1,442 in FY2024. That was an increase from 15% of all investigations to 38% of all investigations. As a consequence of the increase in incomplete investigations, the number and percentage of investigations that were unfounded and substantiated dropped drastically. The number of investigations that were substantiated fell from 799 (21 percent of investigations) in FY2023 to 606 (or 16 percent of investigations) in FY2024. Unfounded remained the most common disposition in FY2024, but the proportion of cases that were unfounded dropped from 58 percent to 41 percent.
CFSA’s communications director did not respond to several emails asking for an explanation of the the jump in incomplete investigations. But it seems likely that this trend stems from the workforce crisis that is affecting CFSA and other child welfare and human services agencies around the country. A spreadsheet that the agency provided to the DC Kincare Alliance shows 27 out of the 36 social workers performing investigations as of August 2024 were carrying more than the 12 to 15 cases that CFSA uses as an indicator of satisfactory performance. This included 19 social workers carrying 20 or more cases and five social workers carrying more than 30 cases. Even more concerning is that the number of social workers doing investigations fell from 42 in January 2024 to 36 in August 2024, according to the spreadsheet.
If social workers are not able to complete the required interviews and collect needed information timely, endangered children may suffer further harm. It is possible that most of the incomplete investigations have been essentially concluded with a determination of findings, leaving only the completion of needed documentation and forms undone as workers hurried to start new investigations. Such a scenario might be somewhat less alarming but would still raise concerns that overburdened social workers are not able to thoroughly investigate allegations, thereby endangering vulnerable children.
In-Home Case Openings and Foster Care Placements
The table below shows the number of in-home case openings and children entering foster care by year. These two numbers cannot be added together because because in-home entries are reported at the case level (with multiple children in many cases) and foster care entries are reported at the child level. However the trends over time can be compared, showing that the number of in-home cases opened dropped between FY2023 and FY2024 while the number of children entering foster care increased. This was the first time the number of children entering foster care increased since FY2021, after the drop in foster care placement due to COVID-19.\

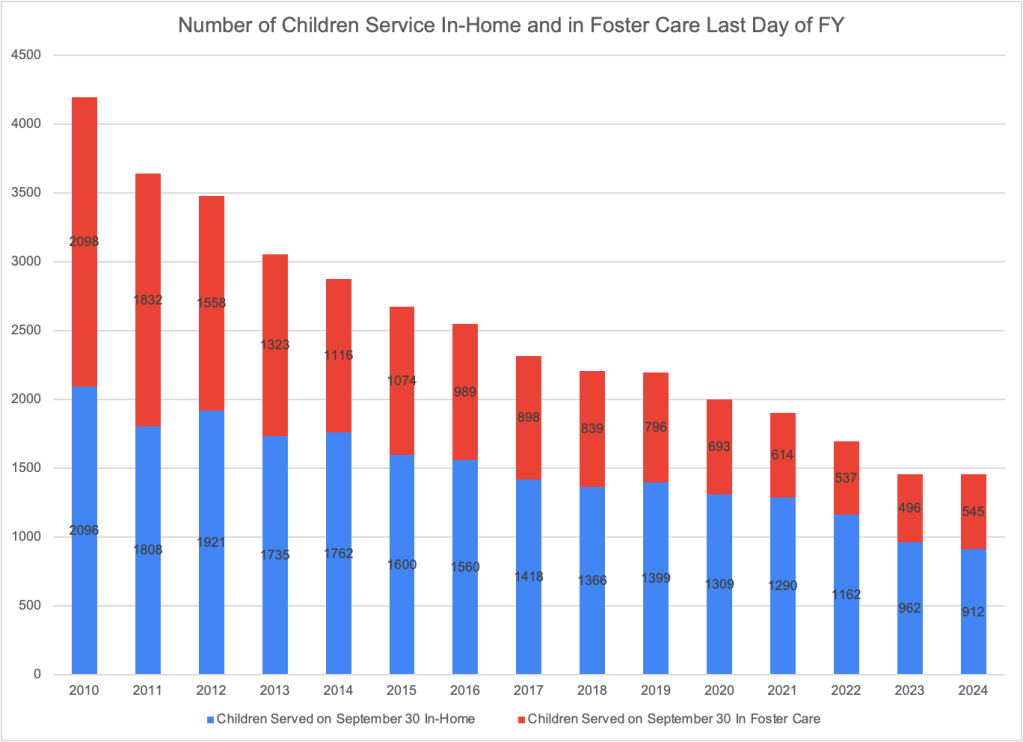
The total number of children served in home and in foster care on the last day of every quarter are available on the CFSA Dashboard and can be added to yield the total number of children served on that date. The chart below shows that the total number of children served on the last day of the fiscal year (September 30) stayed basically the same between FY2023 and FY2024. But the number of children being served in their homes decreased by 50 while the number in foster care increased by 49. FY2024 reverses a trend of annual decreases in the number of children in foster care going back at least as far as 2011.
The increase in the number of children in foster care between September 30, 2023 to September 30, 2024 reflects an excess of entries to foster care over exits from care during FY2024. Specifically, the number of children in foster care at the end of the fiscal year should reflect the number of children in foster care at the end of FY2023, plus the number of entries to foster care during the year, minus the number of exits from foster care. While there is a discrepancy of two between the results of this calculation and the foster care caseload reported by CFSA, the numbers confirm that there were about 50 more entries than exits, so the caseload increased. A similar calculation cannot be performed for children served in their homes, as the entry data are based on cases, not children.
| 2023 FC Caseload | 2024 FC Entries | 2024 FC Exits | 2024 FC Caseload |
| 496 | 243 | 196 | 545 |
It may be reassuring that the number of children served by CFSA changed so little in FY2023. One can hope that despite the high percentage of incomplete investigations, CPS workers are doing what is necessary to find the children that need help and simply leaving some of the paperwork for later. However, such a situation is not sustainable without endangering children. And the 3.6 percent increase in the number of referrals between FY2023 and FY2024 was not met with an increase in the number of children served, which may be a result of the incomplete cases.
It is not possible to understand the FY2024 data without further information from CFSA. How alarming the increase in incomplete investigations may be depends on whether these investigations are truly incomplete or basically finished except for forms and documentation. More concerning still, CFSA caseload data indicates that there are fewer than half the number of social workers doing this work now than in previous years. It is good that the total number of children being served has not dropped precipitously along with the drop in completed investigations. But the public needs to know more about how CFSA is functioning and what it is doing to alleviate the workforce crisis.
