The federal government’s annual maltreatment report for 2021 was released on February 9, 2023, and the child welfare establishment is celebrating. New Child Maltreatment Report Finds Child Abuse and Neglect Decreased to a Five-Year Low, crowed the Administration on Children and Families (ACF). “Number of Abuse and Neglect Victims Declines Again,” trumpeted The Imprint, a journal that typically reflects the prevailing voices in child welfare today. Left for the body of the ACF press release (and totally omitted by The Imprint) was the fact that in 2021 the nation was still in a pandemic that kept many schools closed for much of the year, and that child maltreatment “victimization” reflects jurisdictions’ policy and practice much more than it reflects actual maltreatment. Thus, there is no reason to celebrate a decrease in child maltreatment based on this report.
Child Maltreatment 2021 , the latest edition in the annual series from the ACF, combines data from the 50 states, the District of Columbia and Puerto Rico about the number of reports or children involved in each stage of the child welfare system in Federal Fiscal Year (FFY) 2021, which ran from October 1, 2020 to September 30, 2021. The data are obtained from the National Child Abuse and Neglect Data System (NCANDS), a national data collection program run by the Children’s Bureau under ACF. Arizona did not submit data in time to have its data included in this report, so only 49 states are included in this year’s report, along with the District of Columbia and Puerto Rico. Commentaries from most of the states regarding policies and conditions that may affect their data are attached in an appendix. The report’s findings are summarized in Exhibit S-2. All of the figures in this post are taken from the report.

A family’s journey through the child welfare system starts with an initial report, known as a “referral.” Figure 2-D below shows that the total number of referrals (the purple line) rose between 2017 and 2019, dropped sharply in the wake of the Covid pandemic in 2020, as schools closed and many families isolated at home, and increased only slightly in FFY 2021. It is important to remember that in FFY 2021, which began in October 2020, many schools were still closed. Most schools opened over the course of FFY 2021, but some remained closed the entire year. Thus, reporting from school personnel was suppressed for the federal fiscal year.

The rate of referrals as a portion of the child population varied greatly by state. Table 2-1 of the report shows that the total referral rate per 1,000 children in 2021 ranged from a low of 17.8 in Hawaii to a high of 137.0 in Vermont in 2021. Such differences exist every year and reflect factors such as public opinion and knowledge of child maltreatment reporting, as well as state practices. Some states do not even report most referrals to NCANDS, as described in the state commentaries. Pennsylvania has a unique system in which most reports that are not for abuse are classified as “General Protective Services” and not reported to NCANDS. Similarly, Connecticut does not report referrals receiving an alternative (non investigation) to NCANDS. In 2021, state-to-state differences may also reflect how soon in-person schooling resumed in the state after the pandemic. Vermont reported in its commentary that it has been receiving more referrals for concerns that do not reflect maltreatment. Vermont also included several reasons for its high referral rate, including the fact that reports on multiple children in the same family are counted separately. Kansas reported a decrease in reports due to “engaging communities to focus on prevention.”
Once a referral is received, it can be screened in or out by agency hotline or intake units. In general, agencies screen out referrals that do not meet agency criteria, which vary by jurisdiction. Reasons for screening out a referral may include that it does not meet the definition of child abuse or neglect, that not enough information is provided, that another agency should more appropriately respond, or that the children being referred are over 18. Despite receiving slightly more referrals than the previous year, child welfare agencies screened out a larger proportion of them in FY 2021, resulting in a slight decrease in screened in referrals (known as “reports“), from 2020 to 2021 – the blue line in Exhibit 2-D. In the 46 states that provided both data points, 51.5 percent of referrals were screened in and 48.5 percent were screened out.
There is great diversity in the proportion of referrals accepted by states. The percentage of referrals that was screened-in ranged from 15.3 in South Dakota to 98.5 percent in Alabama.1 There are many reasons for these variations, mostly associated with differing policies and practices between jurisdictions. For example, Georgia mentioned in its commentary that after hotline calls increased in 2021, it adjusted screening criteria to screen out more of them. Indiana tried to reduce its screen-in rate by changing criteria related to sexual behavior among teens and preteens, marijuana use by children, and educational neglect. Kansas reported a decrease in reports due to a change in the screening process for educational neglect. Missouri, on the other hand, changed screening criteria to screen in more referrals out of concern for children isolated because of the pandemic.
In FFY 2019, teachers were the most common source of referrals, submitting 21 percent of all referrals. They lost that position in FFY 2020 with the pandemic school closures, while legal and law enforcement personnel increased their share of reports. Perhaps it is not surprising that teachers did not recoup their leading role in 2021, since many students were still attending school virtually for some part of the year. Teachers actually submitted a smaller proportion of referrals in 2021 (15.4 percent) than in 2020 (17.2 percent). It is possible that teachers were making more calls but that more of these calls were being screened out than in the year before. But since ACF does not show the distribution of all referrals by reporting source, one cannot use this data to test that hypothesis.

Investigations
In Chapter 3 of Child Maltreatment 2021 the focus shifts from the referral or report to the child. ACF estimates that 3.016 million children or 40.7 children per 1,000 in the population received an investigation or alternative response2 in 2021. This was a slight decrease over 2020, when 42.0 per 1,000 children received an investigation or alternative response. These rates varied greatly by state, from a low of 12.8 per 1,000 in Pennsylvania to a high of 129.8 in West Virginia. The low in Pennsylvania is not surprising due to its unique system in which most neglect referrals are not reported to NCANDS. But Maryland and Hawaii also investigated small proportions of children– 15.7 and 15.9 per 1,000. These investigation rates reflect the number of referrals and how many were screened in, as well as the number of children per referral.
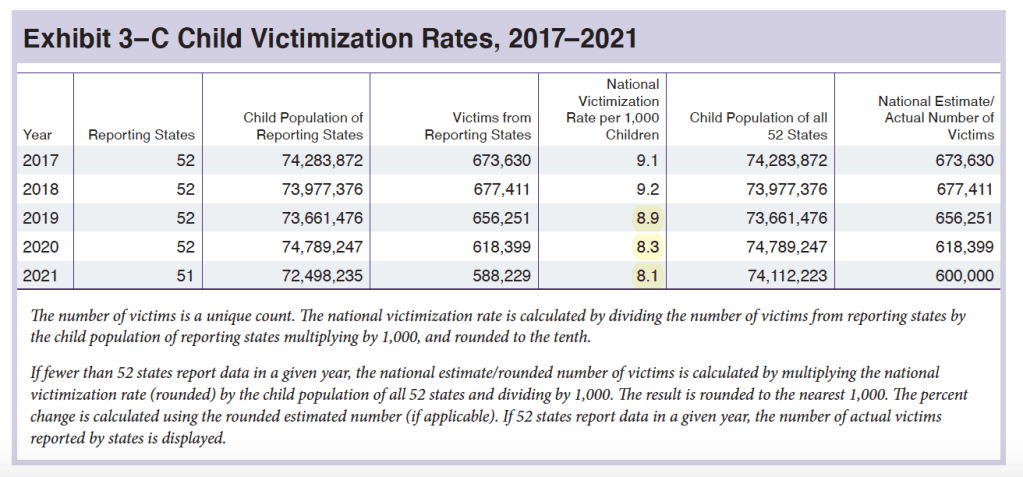
ACF found that of the children who received an investigation or alternative response, 16.7 percent were found to be victims of child abuse or neglect, as shown in Exhibit 3-B.3 The remaining children were not determined to be victims or received an alternative response. Estimating for missing data from Arizona, ACF calculated a national “victimization rate” of 8.1 per 1,000 children. As Exhibit 3-C shows, this rate has been decreasing since 2018 but the greatest decrease was in 2020 with the arrival of the pandemic.
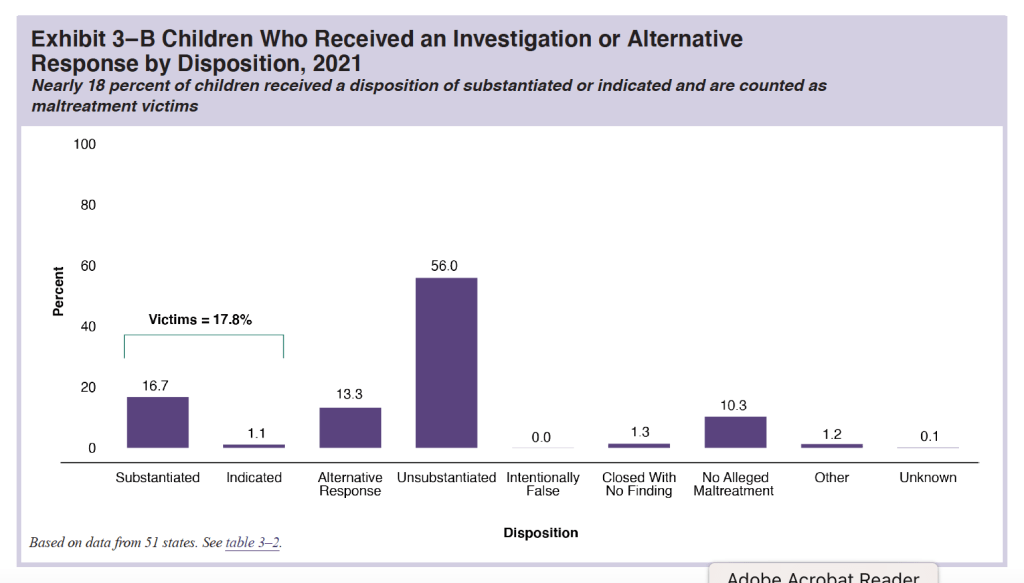
ACF’s use of the term “victimization” can be misleading. An investigator’s decision about the truth of an allegation is based on limited information and is constrained by available time and staff, and evidence indicates that many referrals are unsubstantiated when maltreatment actually exists. Moreover, these rates are dependent on state policies and practices. Because of the misleading nature of the term “victimization,” the term “substantiation” is used for the rest of this commentary. State substantiation rates per 1,000 children ranged from 1.6 in New Jersey (even lower than Pennsylvania’s 1.8) to 17.0 in West Virginia, suggesting that these rates reflect much more than the prevalence of child abuse and neglect.
Among the many factors that can influence state substantiation rates are:
- Differences in referral rates and screening practices, as decribed above;
- Different policies about what is considered child maltreatment and different levels of evidence required to substantiate an abuse allegation;
- Whether and how much a state uses an alternative (non-investigation response);
- Natural and social disasters that may vary in their impact between states. Some states went back to in-person schooling for the entirety of 2021, others opened midyear, and others were virtual almost all year. West Virginia, with the highest substantiation rate, has been particularly hard-hit by the opioid epidemic. The state has the highest overdose mortality rate in the nation;
- Differences in the messages coming from an agency’s leadership about the relative importance of child safety versus family preservation;
- Variations in the use of kinship diversion, the practice of placing children with a relative without court involvement or case opening. If this happens before the investigation is completed, it may result in an “unsubstantiated finding.
All of these factors can change over time, affecting substantiation rate trends from year to year. It is clear that nationwide, the COVID-19 pandemic continued to suppress reports to CPS hotlines, and therefore investigations and maltreatment findings, in 2021. But the effect of the pandemic differed greatly between states: it appears that some states had more in-person days of school in 2021 than in 2020, and others had less. Additionally, several states described changes in their screening practices in 2021, usually to screen in fewer referrals. Delaware and Washington mentioned an increase in reports diverted to differential response as a reason for declining substantiation numbers in FFY 2021. The emphasis on prevention as an alternative to intervention has been increasing in most states, perhaps affecting the likelihood of substantiation. It is possible also that increases in kinship diversion may have reduced substantiation rates: there is no data to prove or disprove this, but concern over this practice is certainly growing.
To state that maltreatment decreased between 2020 and 2021 is to ignore that “maltreatment victimization” is not a measure of actual abuse and neglect. It is the result of a winnowing process that starts even before a referral arrives. At each stage, the numbers remaining may depend on a wide variety of factors, including policy, practice, natural and man-made disasters and more. The vast differences between state data on referrals, reports, investigations and substantiations shows how unlikely it is that the total number of children found to be victims of maltreatment reflects the actual number of maltreated children, and how irresponsible it is to suggest this might be the case.
A note on Child Fatalities
Last year, ACF used a decline in fatalities due to child maltreatment to headline its press release, Child Fatalities Due to Abuse and Neglect Decreased in FY 2020, Report Finds. This year, the number of child abuse and neglect fatalities reported by states increased slightly, a rise that was not the subject of a headline by ACF. Whether there is a small increase like this year or a decrease like last year means very little, for several reasons. As ACF explains, these child fatality counts reflect the federal fiscal years in which the children were determined to have died of maltreatment, which may be different from the year the child actually died. Such determinations may come much later due to the time it takes to complete a death investigation. For example Alabama reported that for the fatalities reported in FFY 2021, the actual dates of death were between FFY’s 2016 and 2021. Michigan even reported that its child fatality data included the child abuse death of twins in 2003 which was revealed by a cold case investigation.
A second problem with the fatality estimates is that they are widely believed to be too low. One reason is that many states report only on fatalities that came to the attention of child protective services agencies. As the report’s authors point out, many child maltreatment fatalities do not become known to agencies when there are no siblings or the family was not involved with the child welfare agency. Moreover, some fatalities resulting from abuse or neglect are labeled as due to accident, “sudden infant death syndrome,” or undetermined or unknown causes because insufficient evidence was found. I recently reviewed the child fatality review report produced by the District of Columbia’s Child and Family Services agency (CFSA). CFSA relied on the decisions of the medical examiner, which chose not to classify as maltreatment deaths an infant who died after a mother who was high on PCP rolled on top of him when sleeping with him in the same bed (counted as “unknown); a baby left on his stomach with a bottle in his mouth when his mother left the apartment (counted as “undertermined); a child who was shot to death by gunmen trying to kill her father, involved in the violent drug trade, outside a liquor store at 11:00 PM (“non-abuse homicide”), and a child who died of an untreated bacterial infection and had beating injuries diagnosed by doctors as due to abuse (“undetermined”). The total number of maltreatment fatalities was estimated at only three for the District in CY 2021, not including those four deaths. Some researchers suggest that the actual number of abuse and neglect fatalities may be as much as twice or three times that given in the Child Maltreatment reports,4 and the District of Columbia data suggest this may well be the case.
Notes
- This leaves out three states that are listed as screening in 100 percent of referrals: Illinois, New Jersey and North Dakota. Both Illinois and New Jersey explained in their state commentaries that reports must meet certain criteria to be accepted for investigation, so it is not clear why they responded that they screen in 100 percent of referrals. North Dakota actually screens in all referrals, but that is more semantic than real. Reports that do not meet agency criteria for a report of suspected chlid abuse or neglect are categorized as receiving an “administrative assessment,” and are not investigated. North Dakota does not report the number of referrals receiving an “adminnistrative assessment;” hence the reports that 100 percent of cases are screened in. It is unclear why New Jersey and Ilinois provided this figure of 100 percent but the reason may be similar.
- Alternative response is, as defined in NCANDS, the “provision of a response other than an investigation that determines if a child or family needs services. A determination of maltreatment is not made and a perpetrator is not determined.”
- NCANDS defines a “victim” as “a child for whom the state determined at least one maltreatment was substantiated or indicated, and a disposition of substantiated or indicated was assigned for a child in a report.” “Indicated” is defined as a disposition that concludes that maltreatment could not be substantiated under state law or policy, but there is a reason to suspect that at least one child may have been maltreated or is at risk of maltreatment.”
- Herman-Giddens, M. E., et al. (1999). Underascertainment of child abuse mortality in the United States. JAMA , 282(5), 463-467. Available from http://jama.jamanetwork.com/article.aspx?articleid=190980. Also, Cotton, E. E. (2006). Administrative case review project, Clark County, Nevada: Report of data analysis, findings and recommendations. Crume, T. L., DiGuiseppi, C., Byers, T., Sirotnak, A. P., & Garrett, C. J. (2002). Underascertainment of child maltreatment fatalities by death certificates, 1990-1998. Pediatrics, 110(2). Abstract available from https://pubmed.ncbi.nlm.nih.gov/12165617/. Herman-Giddens et al. estimate actual child abuse and neglect deaths to be as high as three times the national reported amount; Cotton et al. and Crume et al. found the actual number of deaths to be twice that reported.

 The 21st National Conference on Child abuse and Neglect (NCCAN) sponsored by the Children’s Bureau of the U.S. Department of Human Services (HHS) took place in Washington DC from April 24-26, 2019, and there could be no better window onto the child welfare zeitgeist. NCCAN’s defining spirit was perfectly embodied in the conference theme, Strong and Thriving Families. But the main takeaway for this blogger was how far the field has strayed from its central and defining mission–protecting children.